Slide 3 of 4 from Simple Fishbone Diagram for PowerPoint
Fishbone Diagram for PowerPoint Presentations
Fishbone Diagram for Cause and Effect Analysis
- Diagram
- Fishbone
- Problem Framing Slide
- 16:9
- 100% Editable
The Fishbone Diagram for PowerPoint slide from the Simple Fishbone Diagram for PowerPoint template offers a clear cause-and-effect visualization ideal for root cause analysis in business presentations. This editable slide features vector icons and shapes that help teams identify contributing factors during problem-solving workshops and quality control meetings, enhancing clarity in corporate presentations and pitch decks.
What’s on This Slide
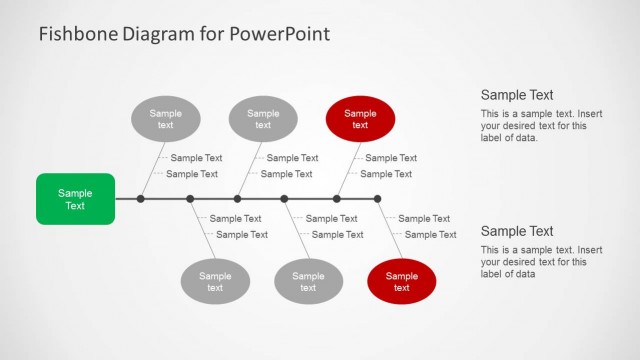
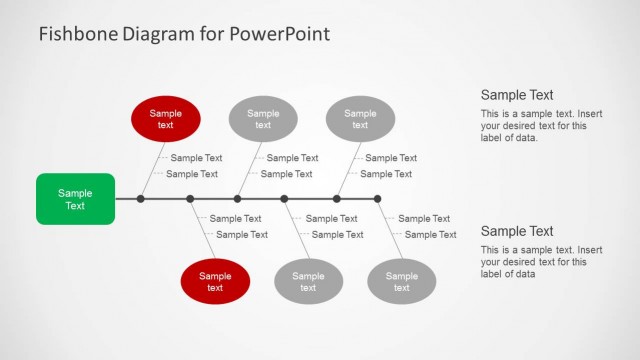
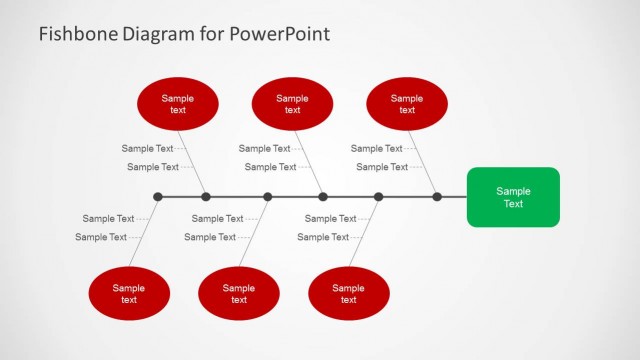
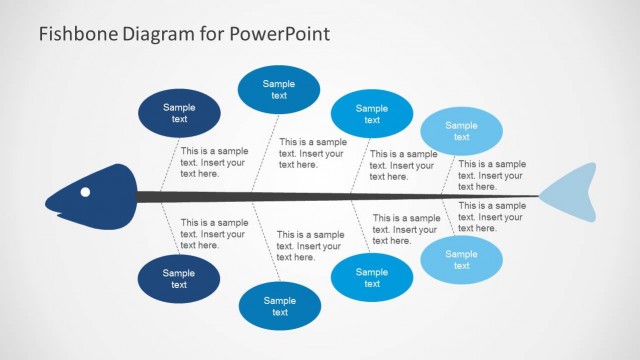
The layout features a horizontal fishbone diagram with a central spine. On the left, a green node labeled 'Sample Text' connects to multiple branching lines. These lines lead to gray and red nodes, each containing 'Sample text' and 'Sample Text' placeholders. The right side includes additional text placeholders for data labels. The overall composition emphasizes a clear flow from the main cause to various contributing factors, with a visual hierarchy established through color differentiation and node shapes. Background is light with no patterns.
How to Use It
This layout serves as a cause-and-effect diagram, ideal for root cause analysis. It fits within a presentation sequence that discusses problems and their contributing factors. Common scenarios include team discussions on project challenges or quality control issues. The diagram allows for clear visualization of relationships between causes and effects, making it suitable for workshops or strategy meetings focused on problem-solving.
Text Placeholders & Capacity
Keep your copy within these limits so it fits without resizing. Node body slots can hold about 10 words each.
| Placeholder | Count | Max characters (approx.) |
|---|---|---|
| Item heading | 6 | 20 |
| Item body | 6 | 50 |
| Chart title | 1 | 30 |
Slide Keywords
Download unlimited PowerPoint templates, charts and graphics for your presentations with our annual plan.
DOWNLOADReturn to Simple Fishbone Diagram for PowerPoint.