Slide 1 of 4 from Simple Fishbone Diagram for PowerPoint
Fishbone Diagram Template for PowerPoint
Simple Fishbone Diagram for PowerPoint
- Diagram
- Fishbone
- Strategic Analysis Slide
- 16:9
- 100% Editable
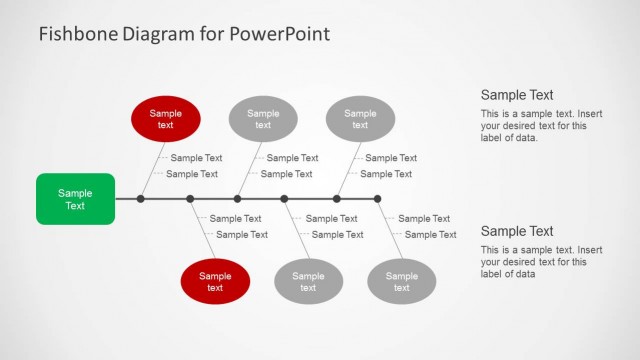
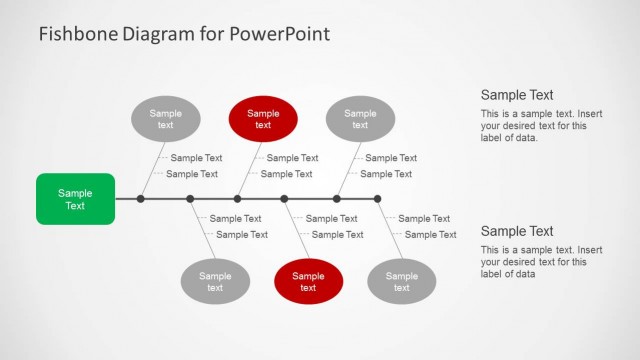
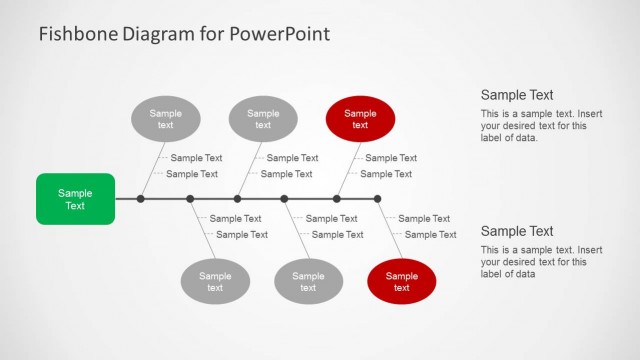
The Fishbone Diagram slide layout from the Simple Fishbone Diagram for PowerPoint template offers a structured visual tool for root cause analysis and problem-solving discussions. This slide uses editable shapes and vector icons to clearly map cause-and-effect relationships, making it suitable for business presentations and team brainstorming sessions. Its design supports effective communication of complex issues within corporate presentations or pitch deck templates.
What’s on This Slide
The layout features a central horizontal line with multiple branching nodes. There are six red oval shapes on the upper side, each containing a text placeholder, and four additional red ovals below. A green rectangle on the right side also contains a text placeholder. The text placeholders are aligned centrally within their shapes. Connecting lines extend from the central line to each oval, indicating relationships. The overall composition is structured to emphasize cause-and-effect relationships, with a clear visual hierarchy established by the color and shape differences.
How to Use It
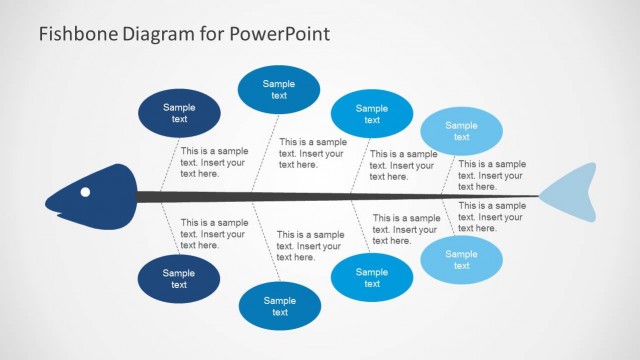
This layout serves as a cause-and-effect diagram, ideal for root cause analysis. It fits well in presentations discussing problem-solving strategies or identifying contributing factors to issues. This structure is useful in team meetings, project reviews, or quality improvement discussions. It allows for a clear visual representation of complex relationships, making it easier to communicate findings and solutions effectively.
Text Placeholders & Capacity
Keep your copy within these limits so it fits without resizing. Node labels can hold about 20 characters each, while the body paragraph can fit roughly 50 characters.
| Placeholder | Count | Max characters (approx.) |
|---|---|---|
| Item heading | 10 | 20 |
| Body paragraph | 1 | 50 |
Slide Keywords
Download unlimited PowerPoint templates, charts and graphics for your presentations with our annual plan.
DOWNLOADReturn to Simple Fishbone Diagram for PowerPoint.