Sales Structure Org Chart PowerPoint Template
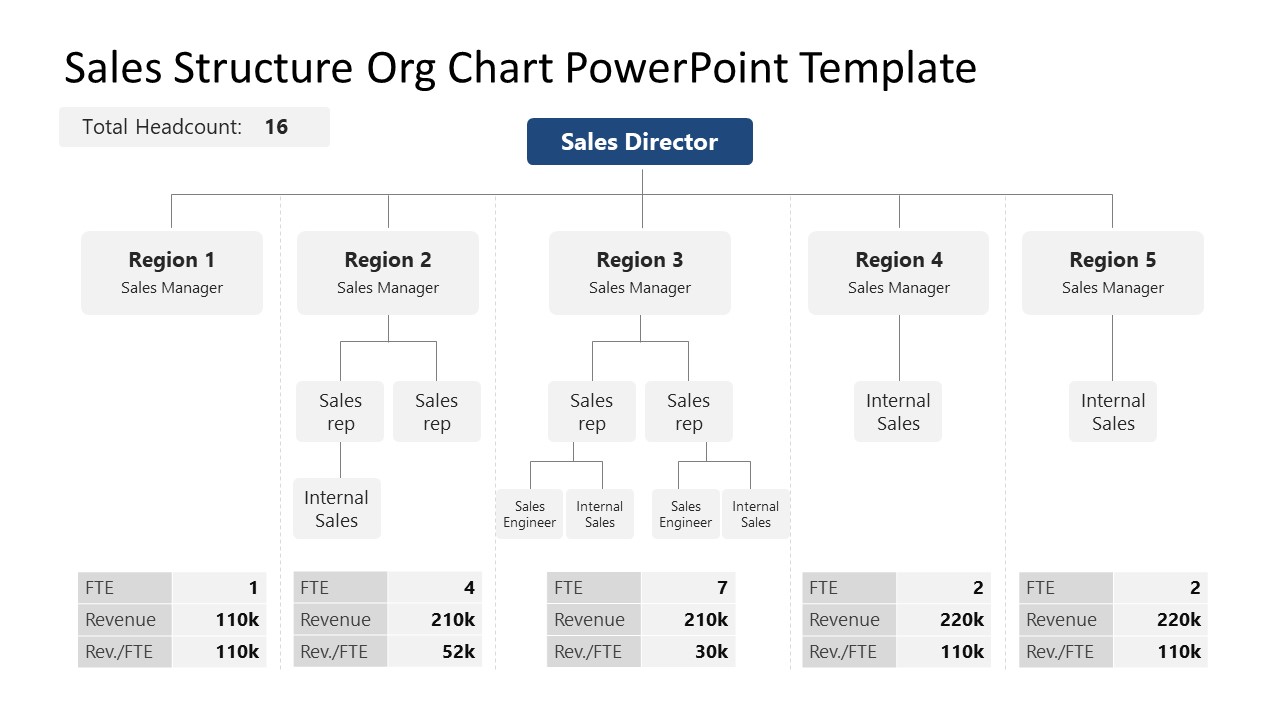
The Sales Structure Org Chart PowerPoint Template is a schematic flowchart representing the hierarchy of a sales team. Companies display their team structure before their employees to increase their understanding of different processes. This sales org chart is simple to edit and shows five branches, each representing the major divisions of the sales department. These branches are further bifurcated, indicating the sub-units. Presenters can use this sales structure PowerPoint template to discuss the roles and responsibilities of the team members. Also, the relative efficiencies and general overview of revenue generation can be demonstrated through this diagram. The Sales Structure Org Chart can also help presenters explain their business structure to potential business partners and investors.
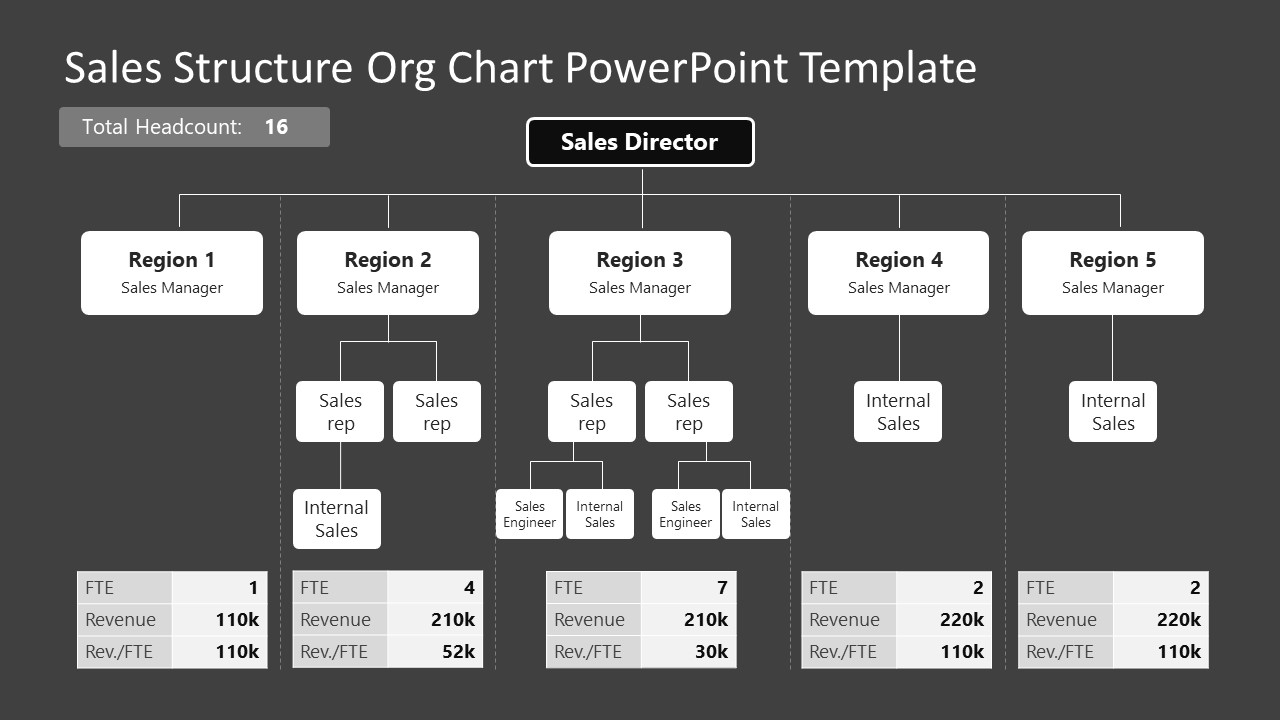
Our Sales Structure Org Chart PowerPoint Template is a one-pager sales structure layout with two background color options. The slide begins with a title section on the top and a text box to mention the total headcount of the team. Below this title region, the flow chart starts with a text box of sales directors with five branches denoting the sales managers of the regions. These five segments are divided by dotted lines, and multiple sub-sections are drawn from each title. For instance, there are two hierarchy levels after the Region 3 Sales Manager, i.e., sales representative, sales engineer, and internal sales. Users can edit the designations according to their sales structure.
Professionals can also mention the FTEs and revenue generation by each region in the specific text boxes of these flowchart segments. Thus, it can help executives monitor the department sections’ performance and advice them to make improvements. So, download this 100% editable sales structure org chart and display your organization’s sales structure in professional meetings.
Alternatively discover our PowerPoint Org Chart Templates and also how to create an Org Chart in PowerPoint.
