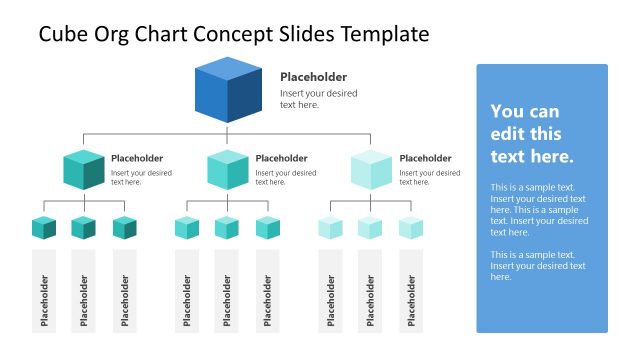
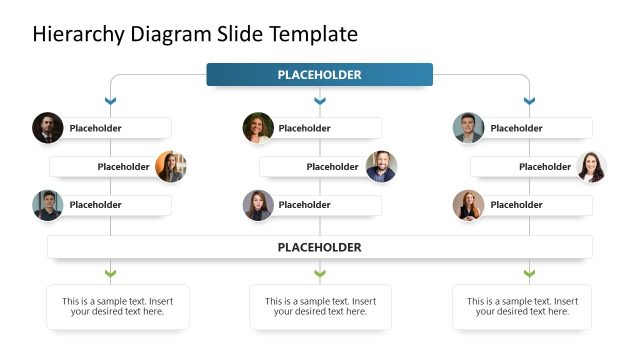
Organizational Charts (also known as Organigrams) are diagrams that represent the structure of an organization and the relationships and ranks of its parts, divisions, and roles.
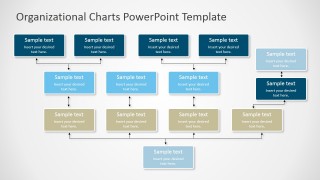
The Organizational Charts PowerPoint Template is a set of comprehensive Org Charts, with different structures generally applied in organizations. Users can describe the other employee relationships and reporting structures with the following frameworks:
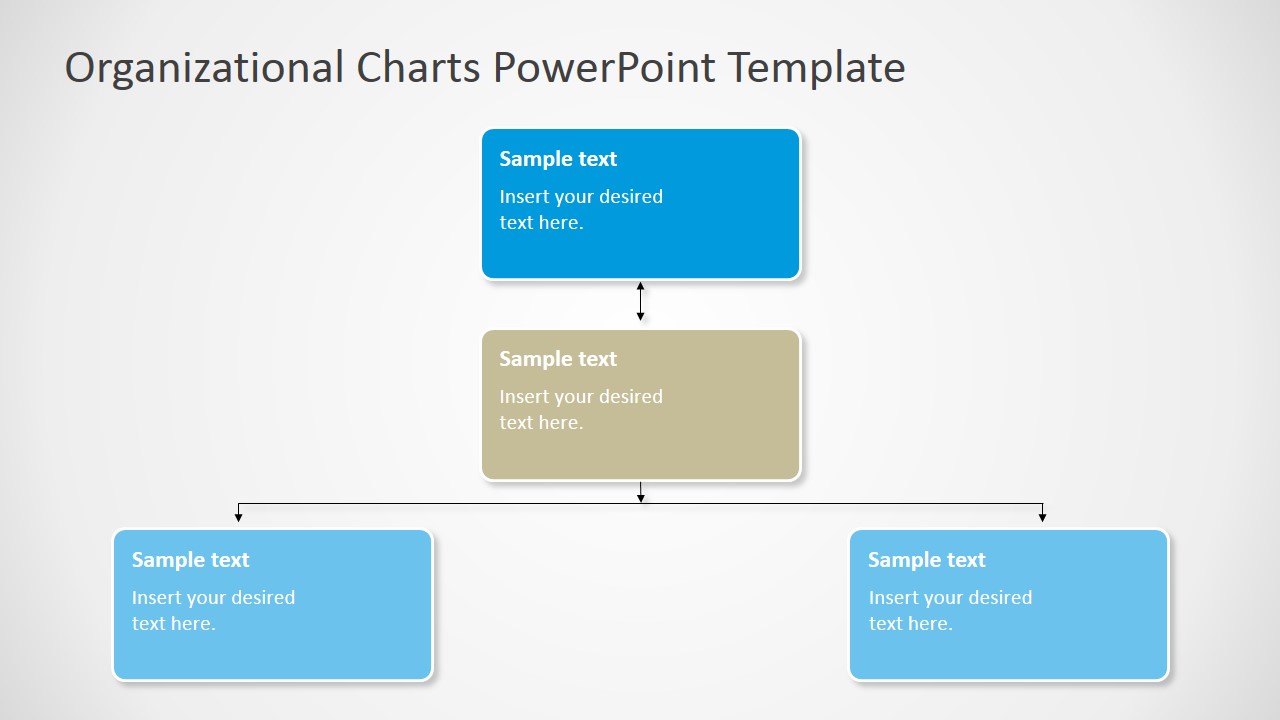
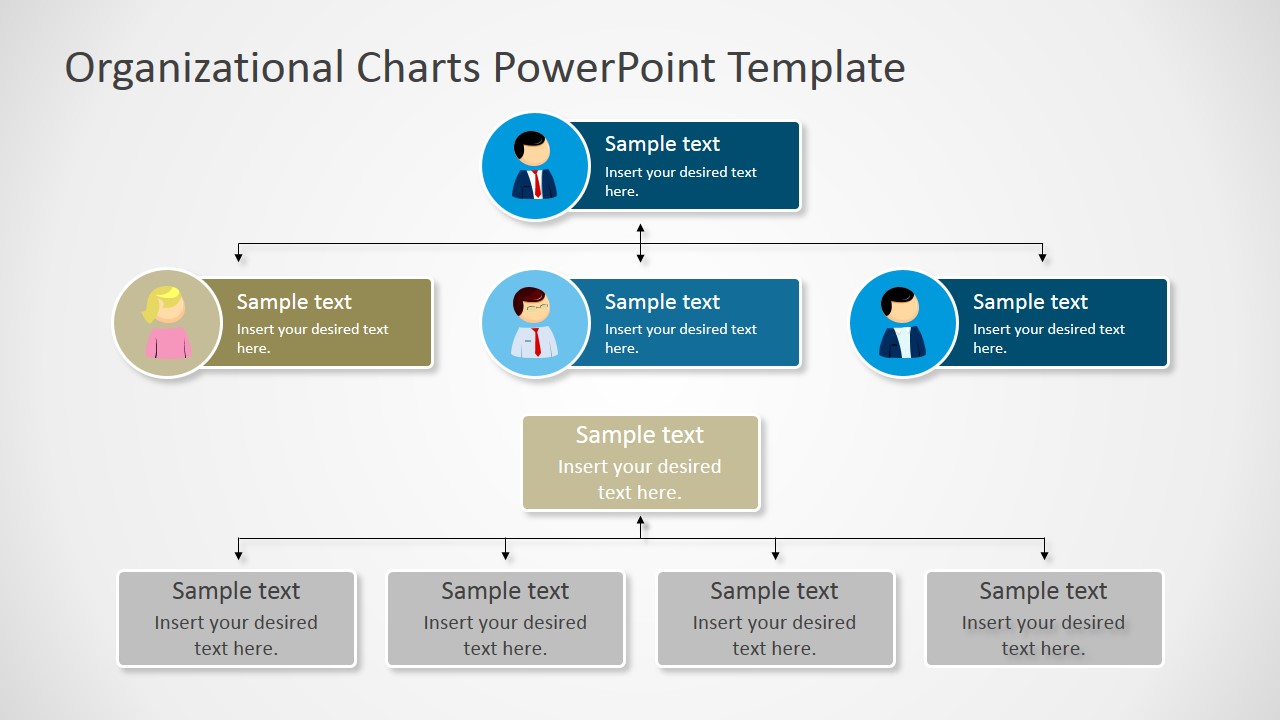
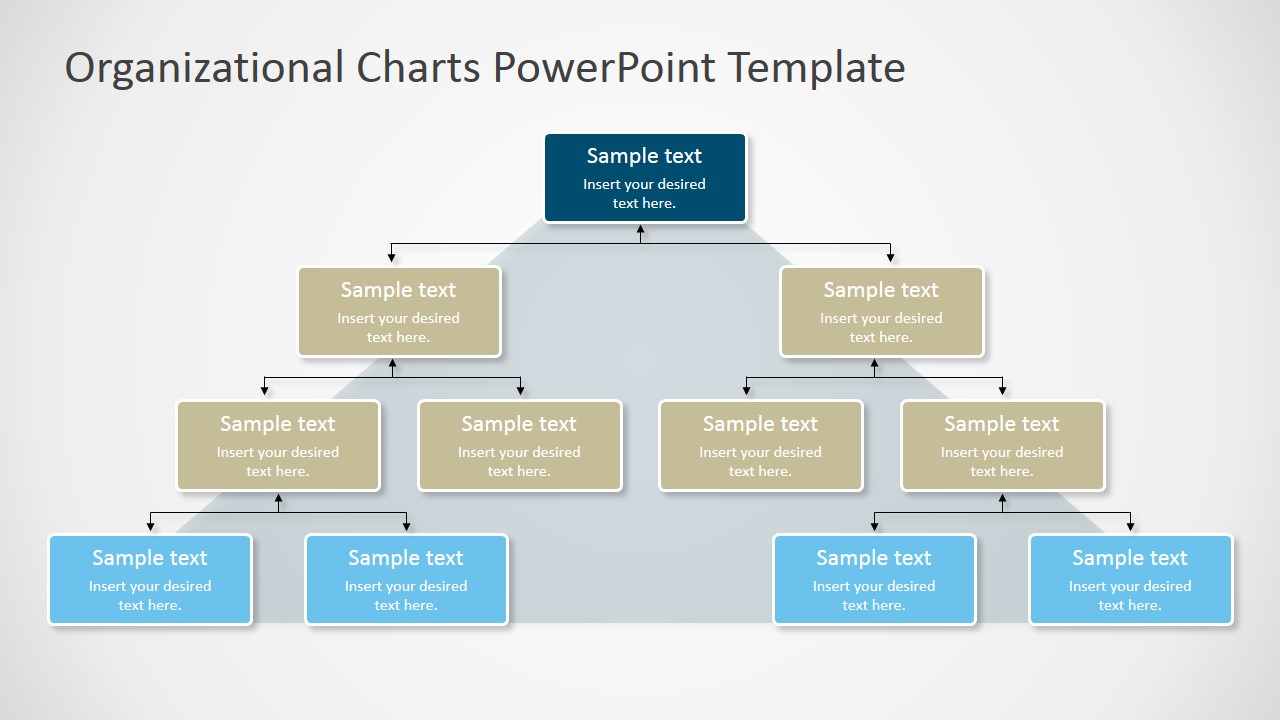
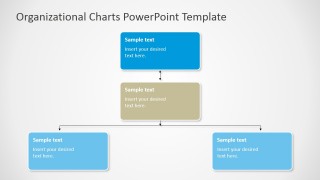
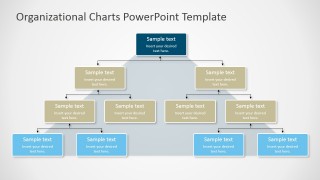
- The Traditional Tree Organizational Chart.
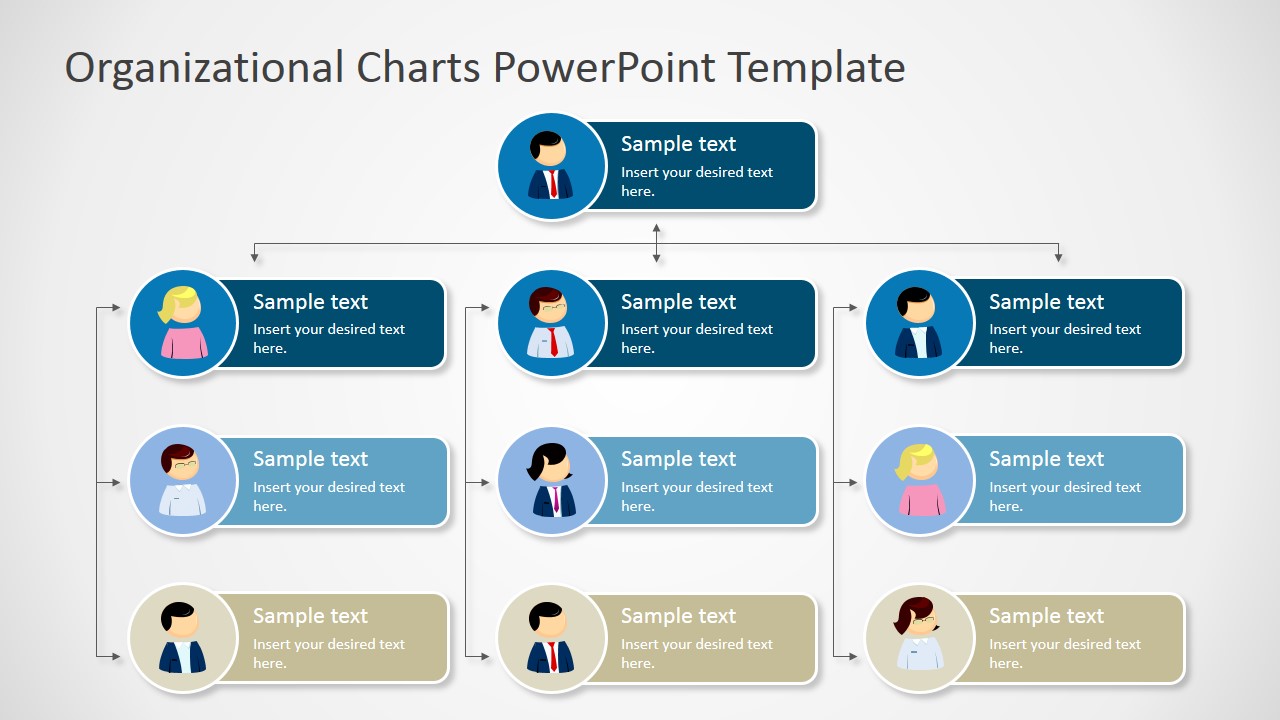
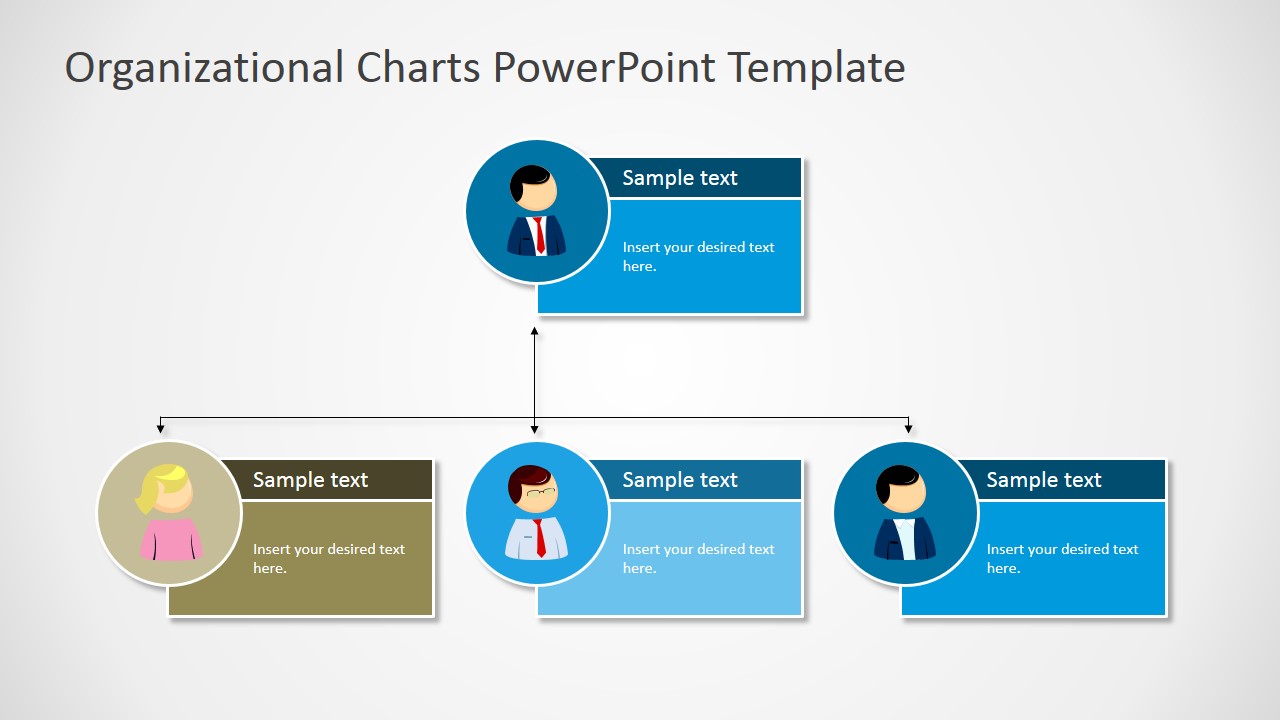
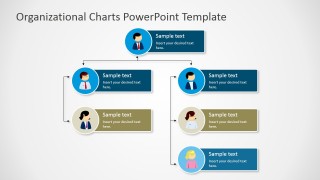
- Hierarchical Org Charts. These diagrams represent a structure where every entity in an organization is subordinate to another entity.
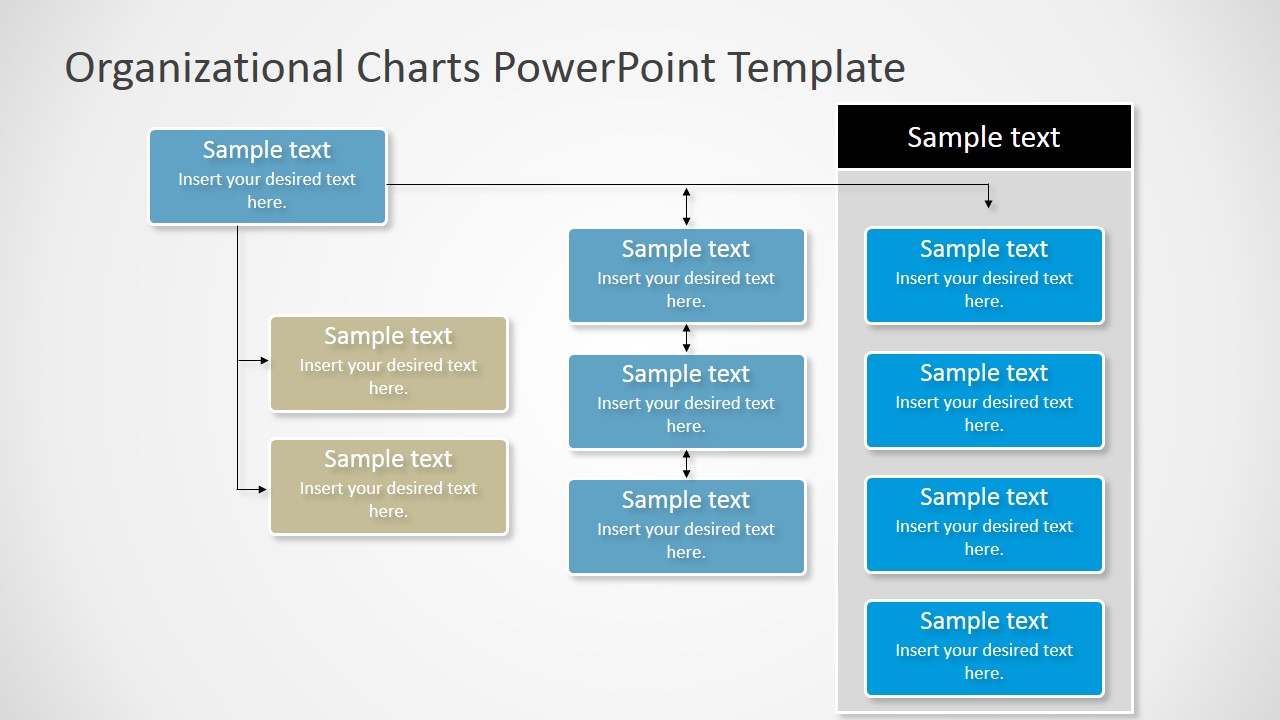
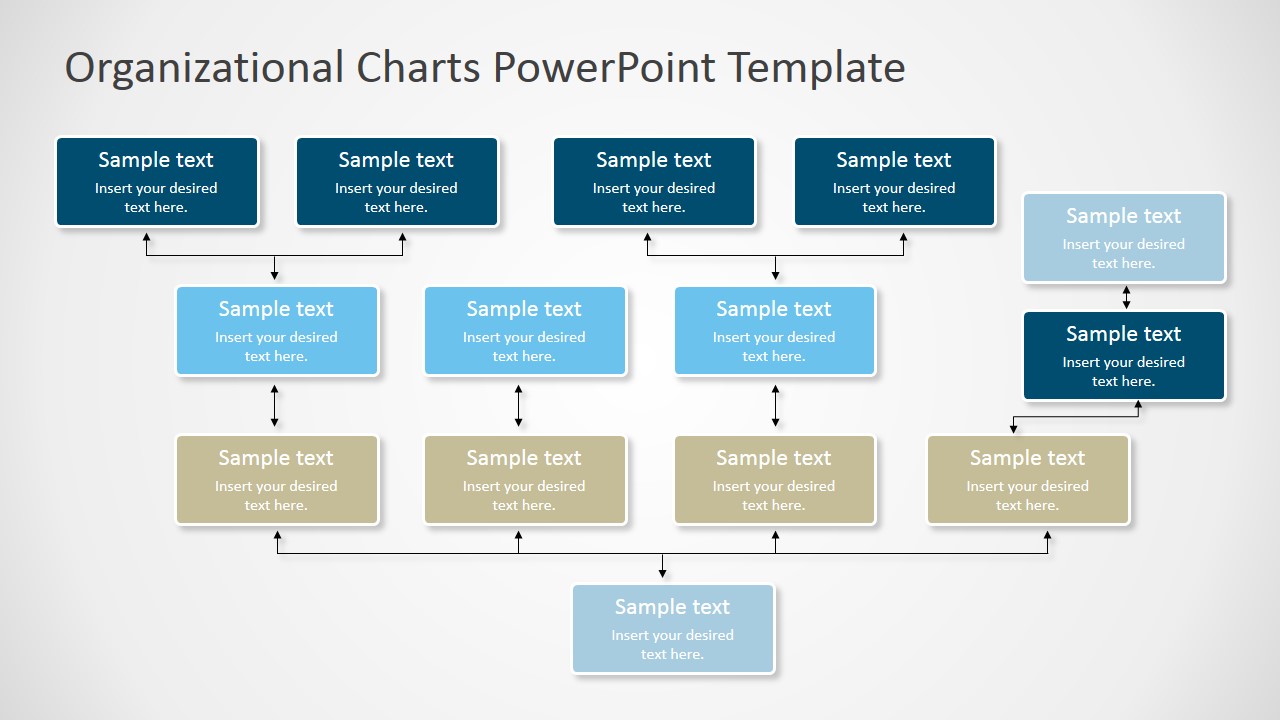
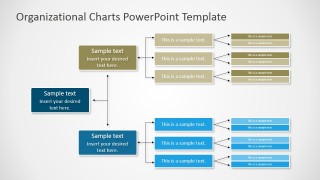
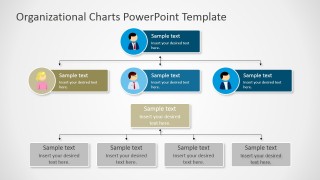
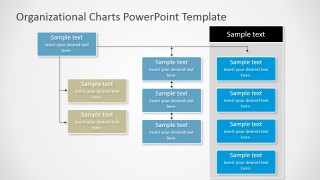
- Functional Organizational Chart. These diagrams represent organizations divided into “functional” divisions, where each can be structured individually.
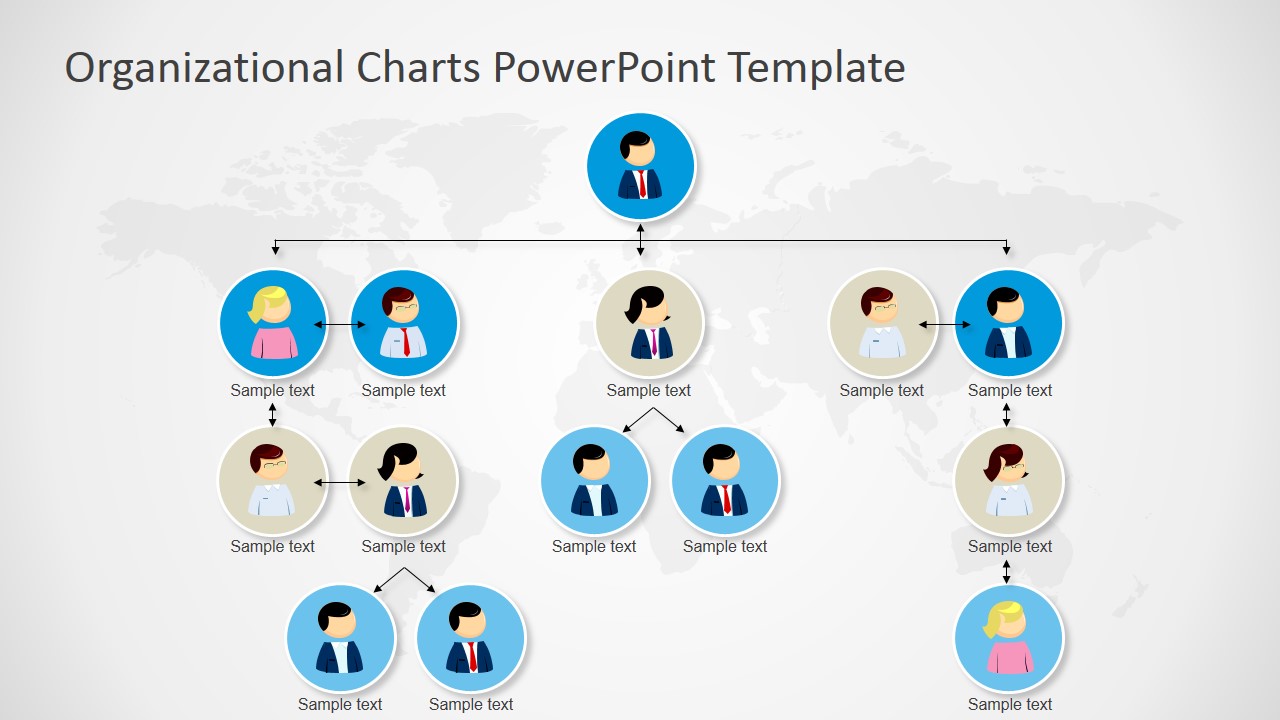
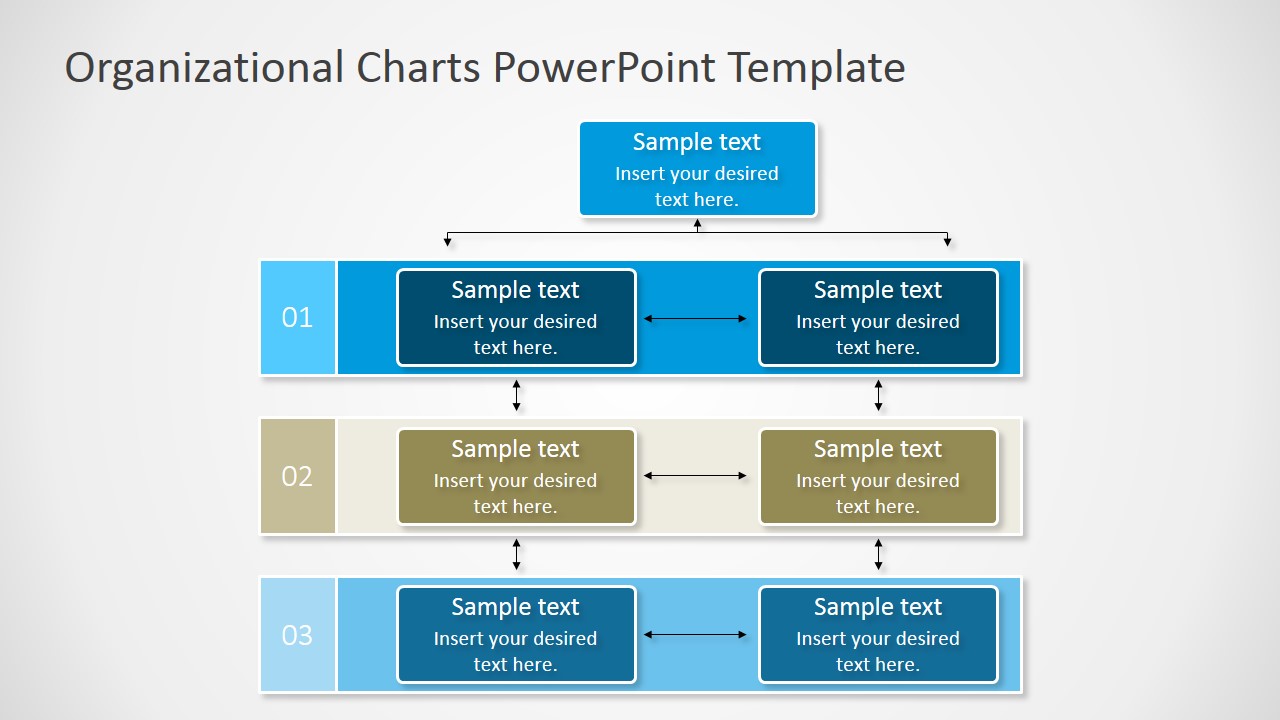
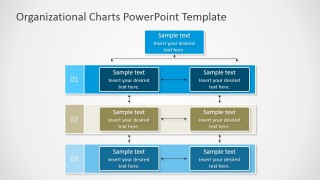
- The Layered Organizational Chart. These diagrams represent entities inside a layer (flat relationship) and the hierarchical relationship between layers.
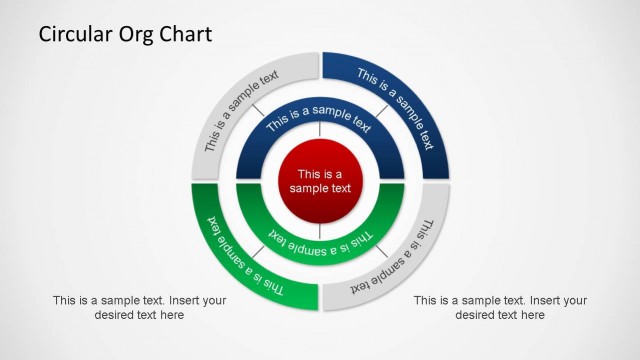
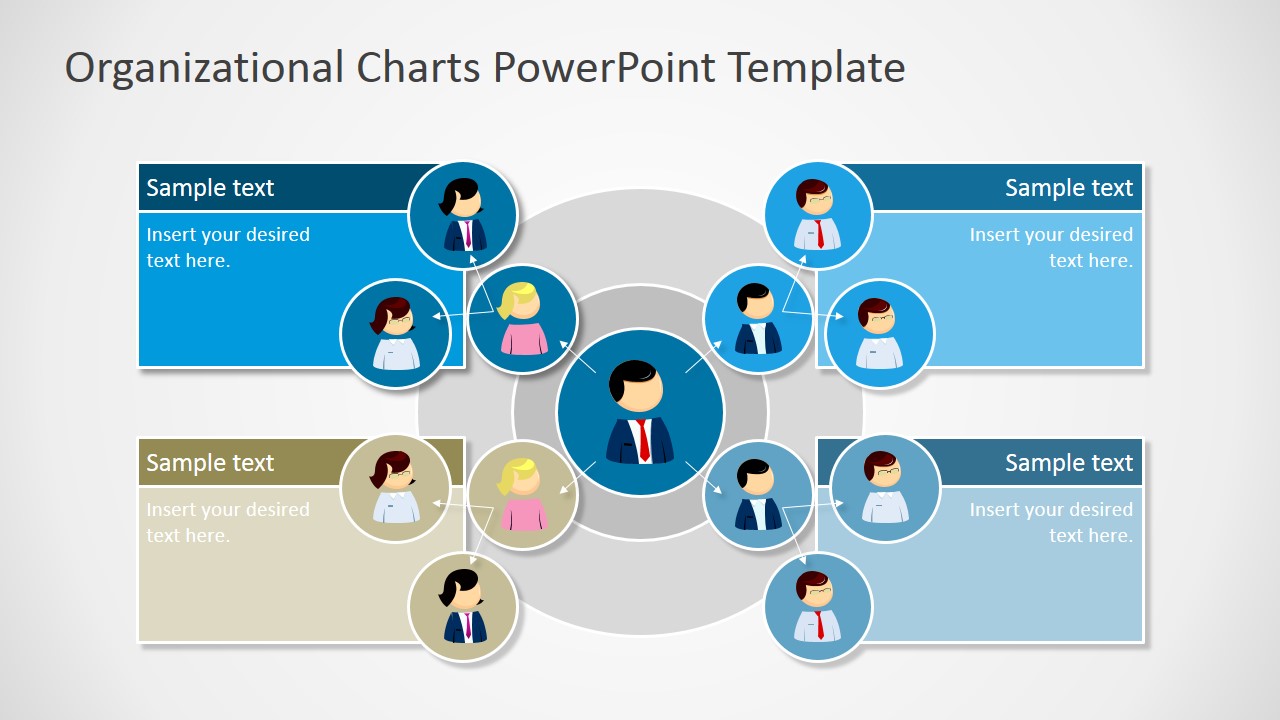
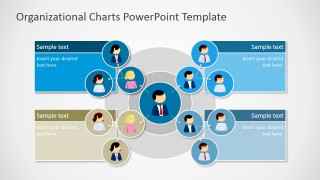
- The Matrixed Organizational Chart. A Circular Org Chart. These organizational charts are a unique visualization of a matrixed organization (alternatively, you can download the matrix org chart PowerPoint template)
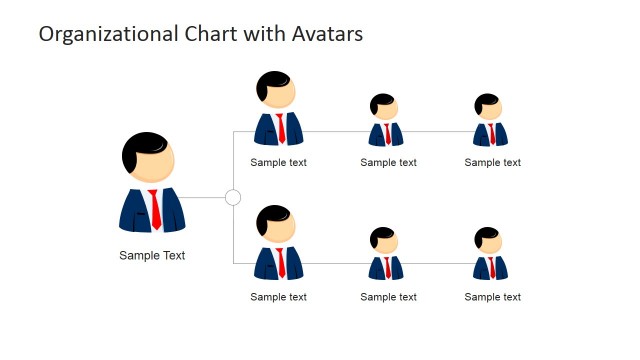
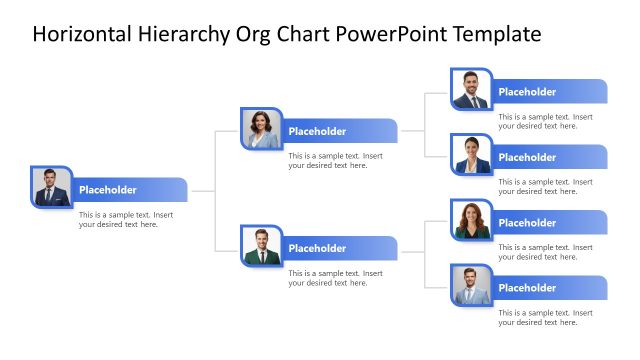
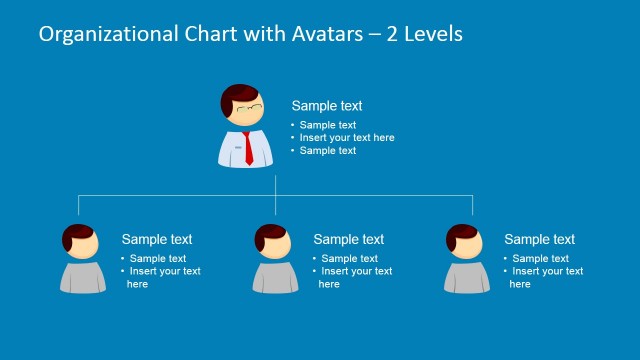
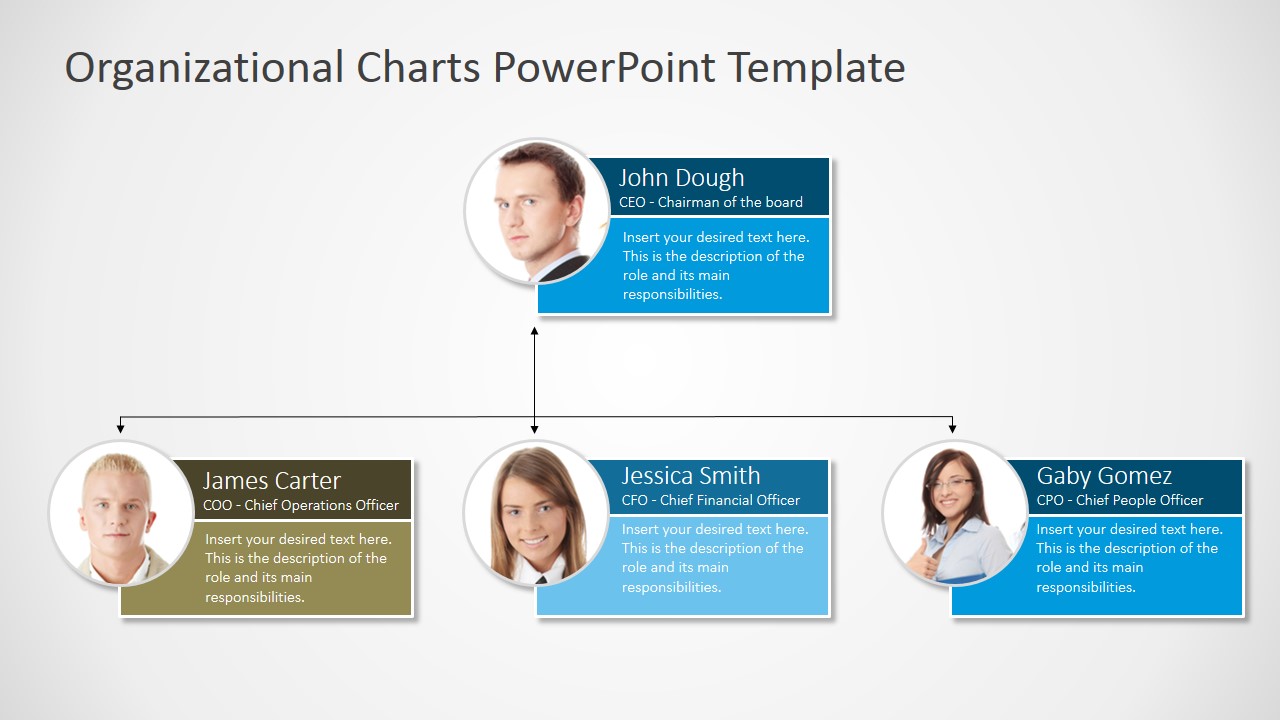
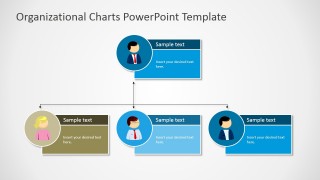
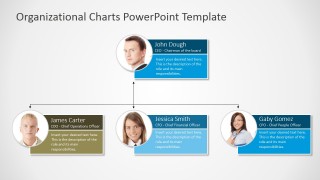
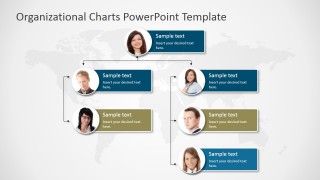
The Org Chart template provides avatars to describe people and roles. It also provides generic stock photos to represent real people in the charts. The user can easily edit each person’s placeholder to replace it with proprietary content, images, or icons. Each of the placeholders is created with PowerPoint Shapes. The user can customize the palette just by changing the template theme. Alternatively, you can download other PowerPoint org chart templates, hierarchy PowerPoint templates or learn more about the different types of org chart layouts and structures available.
Create Professional Org Chart in PowerPoint with SlideModel.com and impress your audience.
What’s inside this template
Example presentation scenarios
- An HR director can use the photo-based leadership chart to introduce executives, department heads, and direct-report relationships during an employee town hall.
- A management consultant can use the circular matrix org chart to explain cross-functional accountability, shared leadership, and dotted-line relationships in a transformation project.
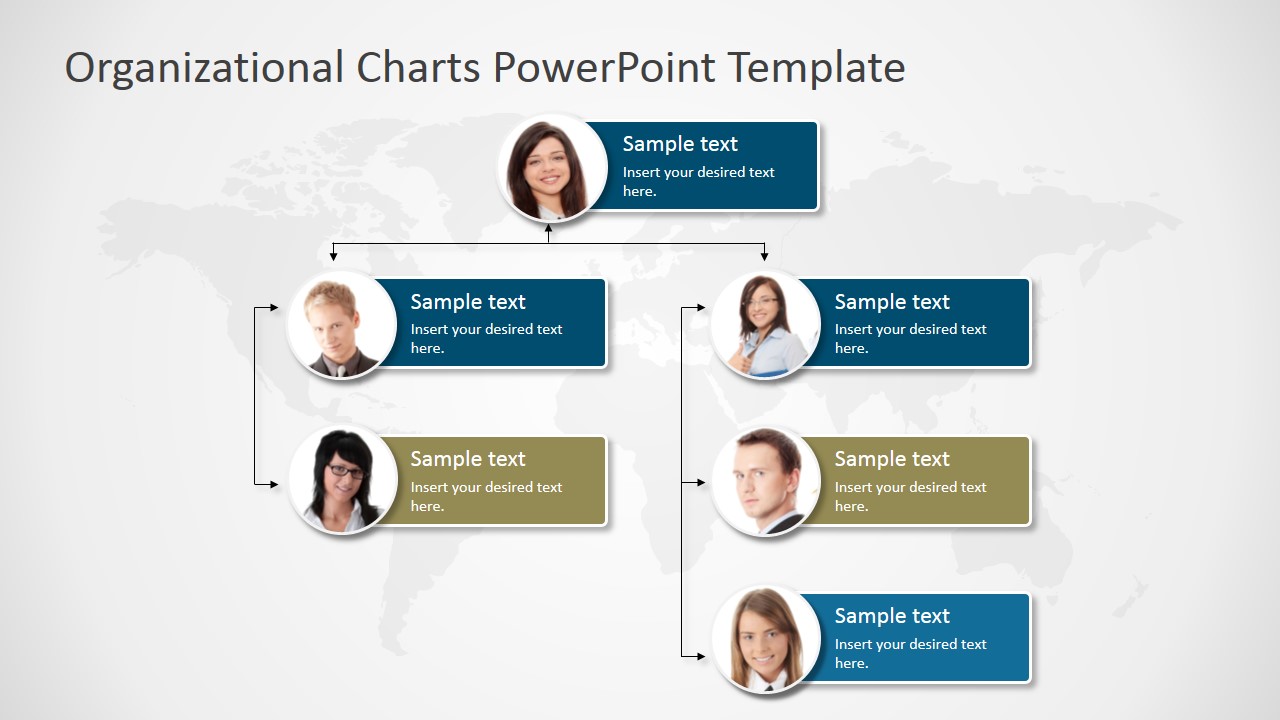
- A department manager can use the three-person and two-column hierarchy slides to clarify team roles, managers, and reporting paths during onboarding.
- An operations leader can use the functional organization diagram to compare workstreams, responsibilities, and handoffs across two or more business units.
Features
- 100% editable presentation template
- Compatible with Microsoft PowerPoint and Google Slides
- 16:9 aspect ratio slides
- Scalable vector shapes, icons and illustrations
- AI-Ready for Microsoft Copilot and Claude
- Instant access and download
Frequently asked questions
Q: How should a presenter explain a complex organization without overwhelming the audience?
A: Start with the simplest hierarchy slide that matches the audience's need, such as the top-down tree or two-column structure. Show only the roles that matter for the decision or briefing. Use the circular matrix layout only after the basic reporting chain is clear, so cross-functional relationships feel like added context rather than clutter.
Q: Who is this template best suited for in a business presentation?
A: This template is best for HR leaders, executives, consultants, and department heads who need to show how people, teams, or functions connect. It works well for onboarding, restructuring updates, leadership introductions, operating model reviews, and merger integration briefings where the audience must understand authority, accountability, and reporting paths.
Q: Why do the avatar, photo, tree, and circular layouts improve an org chart presentation?
A: The visual mix separates different communication jobs. Photos make named leadership roles feel concrete, avatars make generic positions easy to scan, tree diagrams clarify chain of command, and the circular matrix metaphor shows relationships that do not fit a strict vertical hierarchy. This helps the presenter choose the right mental model for each structure.


Organizational Charts PowerPoint Template
14-slide presentation template for org charts, hierarchy diagrams, and reporting structures in business teams
Organizational Charts PowerPoint Template is a 14-slide deck for mapping company structure in Microsoft PowerPoint and Google Slides. It includes traditional tree org charts, hierarchical avatar charts, layered relationship diagrams, circular matrix layouts, and functional reporting structures for executives, HR teams, consultants, and managers.
- Category
- Business PowerPoint Templates
- Rating


 Loading...
- Aspect ratio
- 16:9, 4:3
- Item ID
- 7124-02
- Colors
 Microsoft PowerPoint
  Microsoft Copilot
  Claude for PowerPoint
 Other formats supported
Subscribe today and get immediate
access to download our PowerPoint templates.