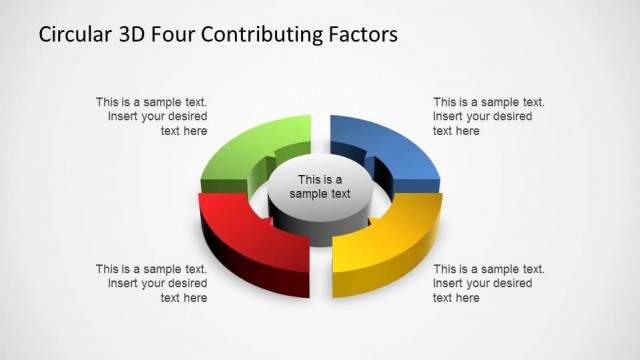
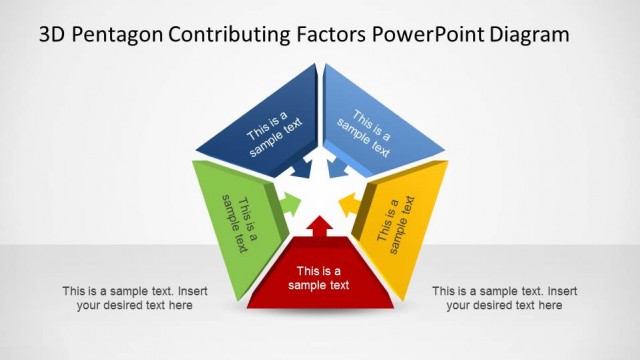
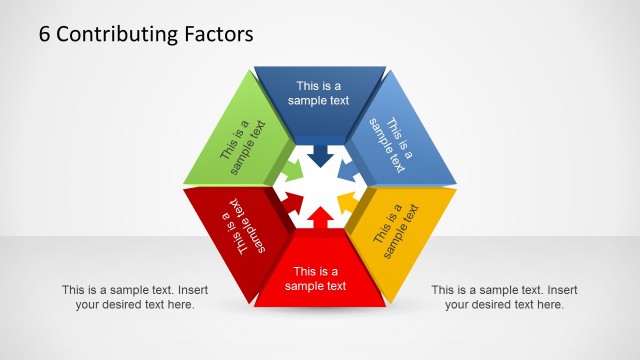
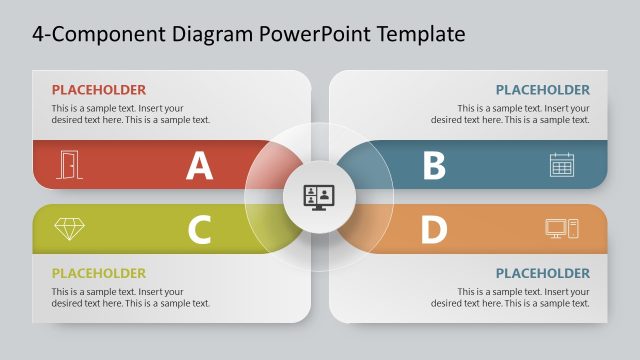
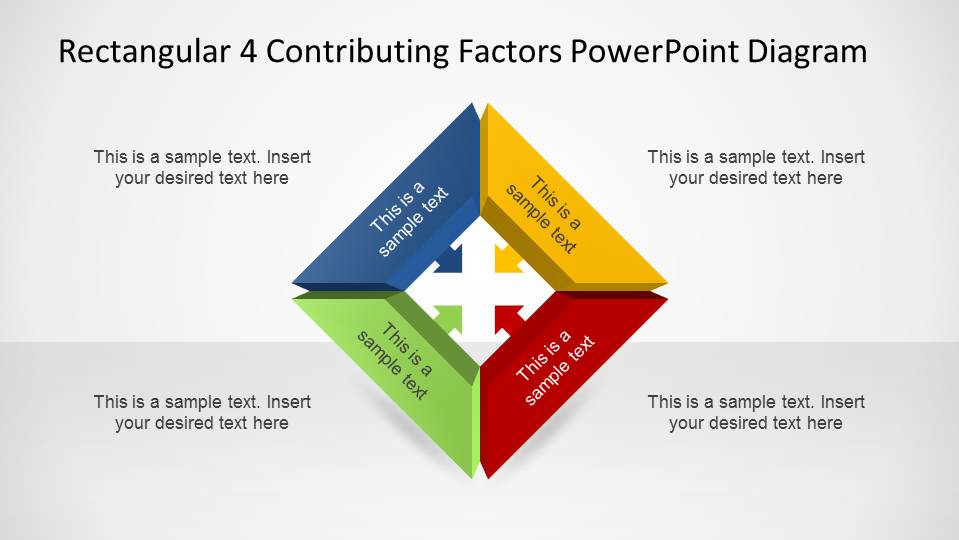
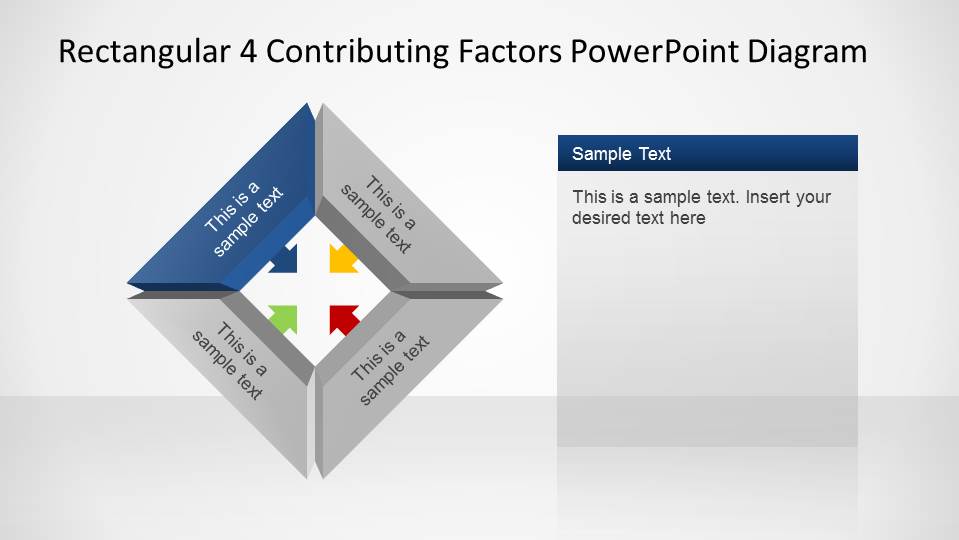
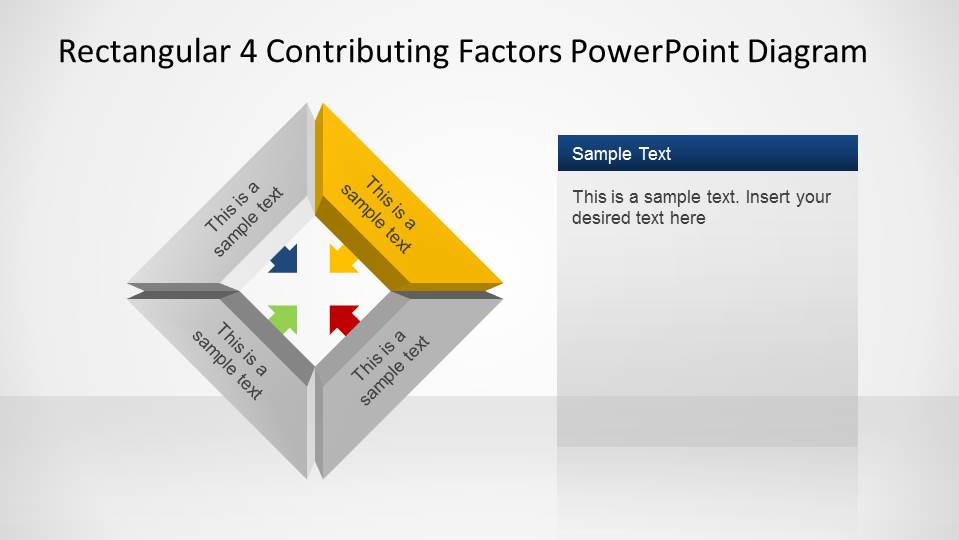
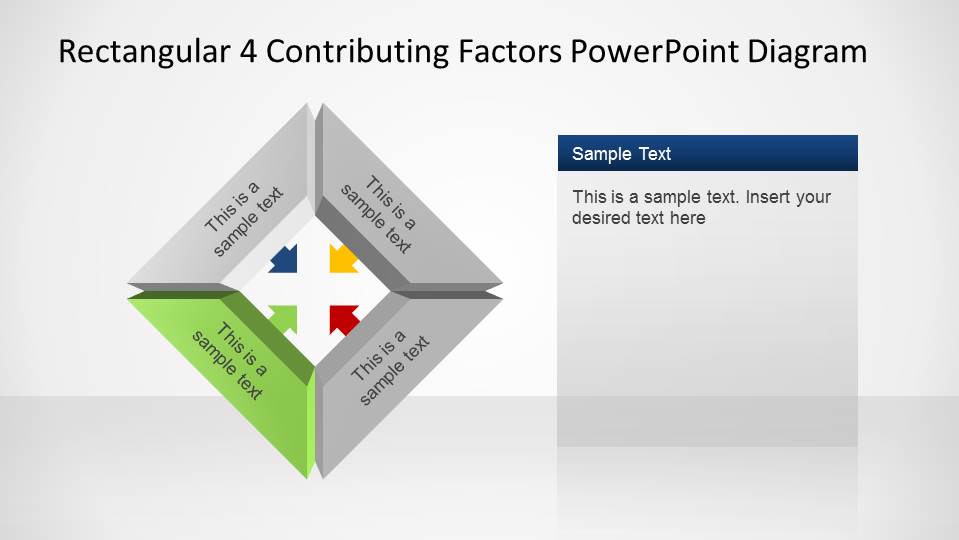
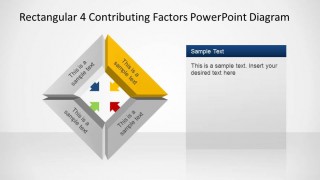
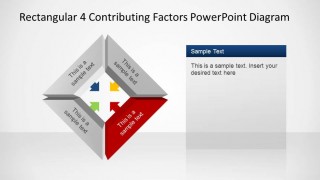
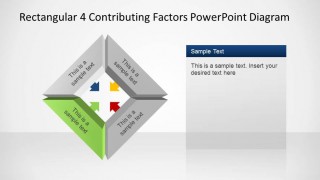
Rectangular 4 Contributing Factors PowerPoint Diagram is a presentation containing five slides with a four steps square diagram, with pointing arrows to the center. The square band is created with 3D trapezoid objects with a brilliant colorful palette of yellow, red, blue and green with adequate gradients and shadows. Each object is created with PowerPoint shapes, enabling the user to customize each object property in order to adapt the diagram to the user presentation needs.
Contributing Factors Diagrams are extensively used for Root Cause Analysis as a complement of each branch of the Ishikawa diagram. Use this professional Rectangular 4 Contributing Factors PowerPoint Diagram to improve your presentation and impress your audience. Describe pushing forces or incidental factors of a topic with this simple to use and simple to customize Rectangular 4 Contributing Factors PowerPoint Diagram.
Complement your Contributing Factors lecture with additional PowerPoint Diagrams from our extensive content catalog.
What’s inside this template
Example presentation scenarios
- An operations manager can use the full-color 4-factor diagram to introduce the main causes behind a recurring process issue during a review meeting.
- A risk analyst can use the single-factor highlight slides to walk executives through four incident contributors without crowding one slide with too much explanation.
- A consultant can map client findings into the blue, yellow, red, and green segments, then use the callout panels to explain evidence or recommended actions.
- A quality improvement team can adapt the factor labels to summarize root cause analysis findings and discuss each highlighted quadrant with department leads.
Features
- 100% editable presentation template
- Compatible with Microsoft PowerPoint and Google Slides
- 16:9 aspect ratio slides
- Scalable vector shapes, icons and illustrations
- AI-Ready for Microsoft Copilot and Claude
- Instant access and download
Frequently asked questions
Q: How should a presenter explain the four-factor diagram without making it feel like four unrelated points?
A: Start with the center issue or outcome, then define what each colored segment contributes to that outcome. Use Slide 1 to show the full relationship, and use Slides 2 through 5 to isolate one factor at a time. Keep each callout focused on the factor's effect, evidence, and decision implication.
Q: Who is this template best suited for in a business presentation?
A: This template fits presenters who need to explain why something happened or what conditions shaped an outcome. Operations, quality, risk, and consulting teams can use the four 3D factor segments to organize root cause analysis, incident contributors, or process influences in a way that is easier to discuss than a dense report page.
Q: Why use inward-pointing 3D segments instead of a standard bullet list?
A: The rectangular loop makes each factor look connected to the same central issue, which supports cause-and-effect thinking. The colored overview slide gives the audience the full system first, while the gray-and-color highlight slides direct attention to one contributing factor at a time. This sequencing reduces split attention during analysis.

Rectangular 4 Contributing Factors PowerPoint Diagram
5-slide presentation template for 4-factor root cause diagrams and incident contributing factors
Rectangular 4 Contributing Factors PowerPoint Diagram is a 5-slide diagram template for showing four causes, forces, or inputs around one central issue. It includes a full-color 3D rectangular factor diagram, four single-factor highlight layouts, callout text panels, and editable PowerPoint shapes for Microsoft PowerPoint and Google Slides.
- Category
- Diagrams
- Rating


 Loading...
- Aspect ratio
- 16:9
- Item ID
- 6487-03
- Colors
 Microsoft PowerPoint
  Microsoft Copilot
  Claude for PowerPoint
 Other formats supported
Subscribe today and get immediate
access to download our PowerPoint templates.