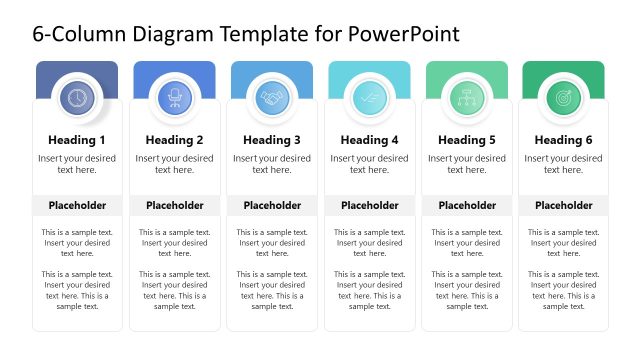
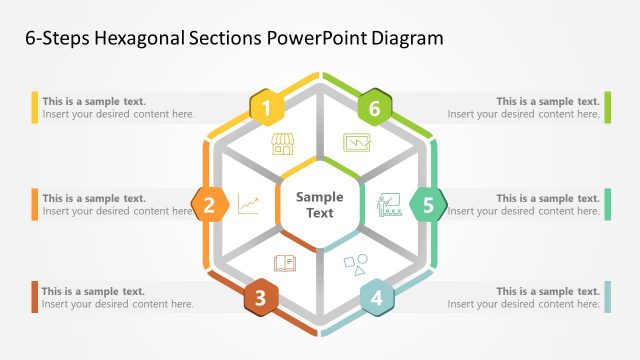
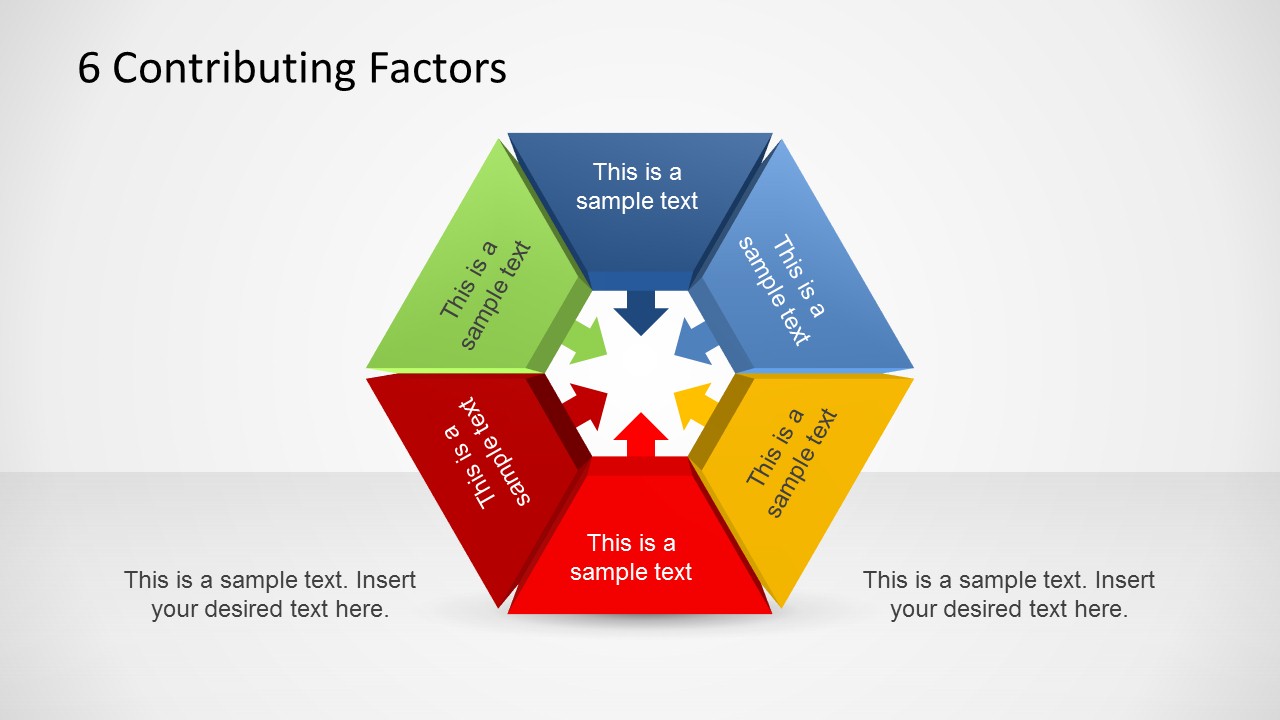
6 Contributing Factors Diagram Template for PowerPoint is a professionally designed diagram template for displaying six contributing factors related to a variable.
The template comes with various sample layouts which can be conveniently edited for crafting a diagram that best matches your presentation topic.
All slides are easy to edit and can be customized right down to even the most minor objects.
What’s inside this template
Example presentation scenarios
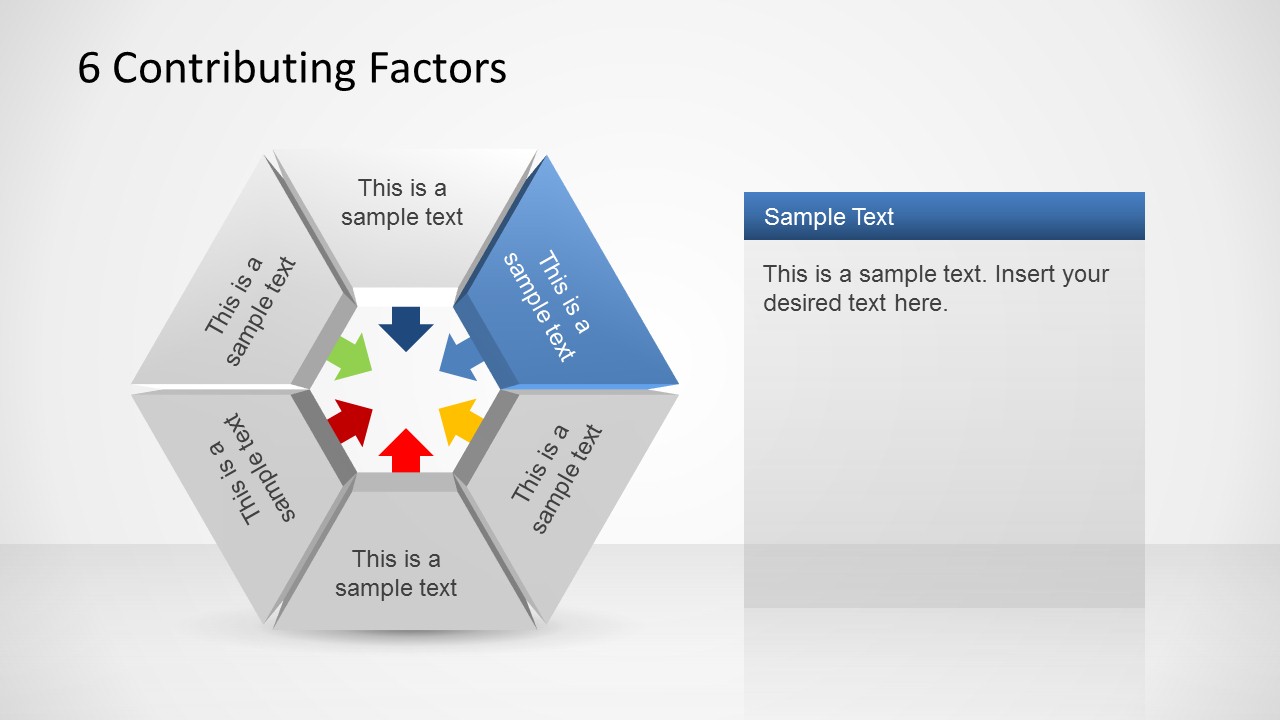
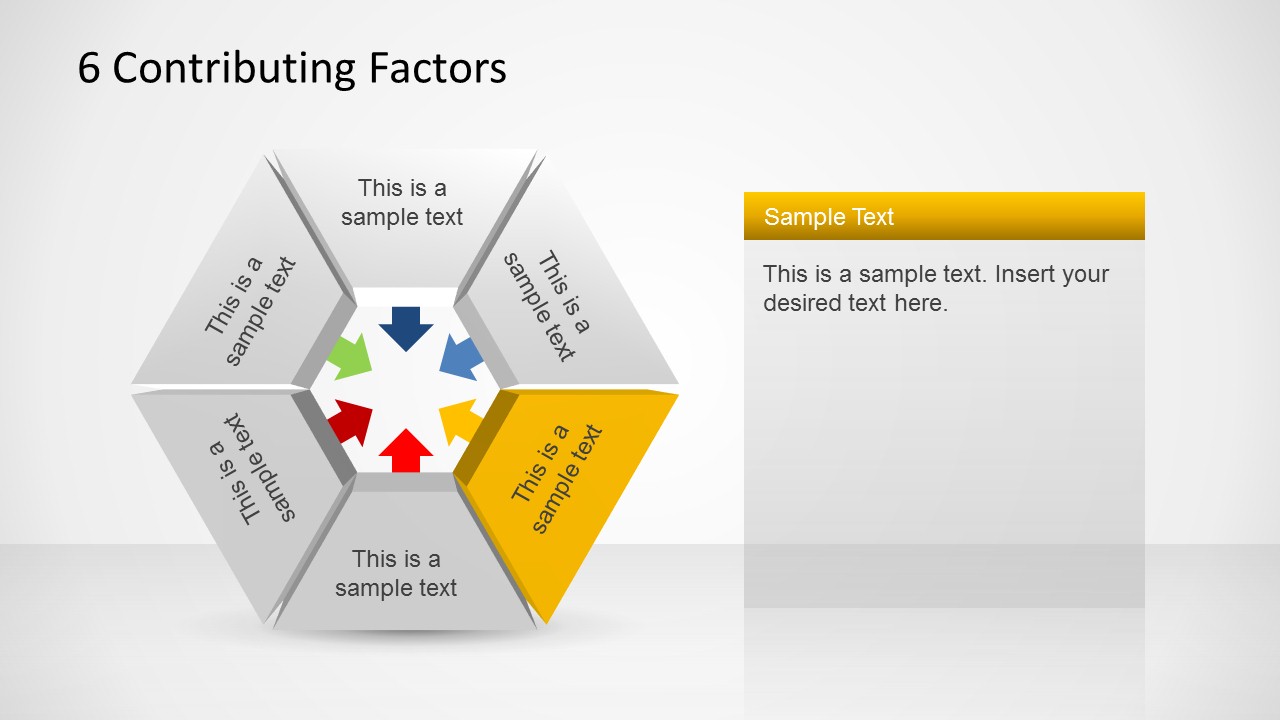
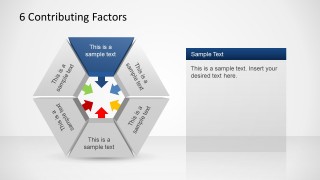
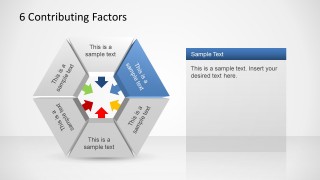
- A business analyst can use the highlighted-factor callout slides to explain the six root causes behind a performance issue and give each factor its own supporting detail.
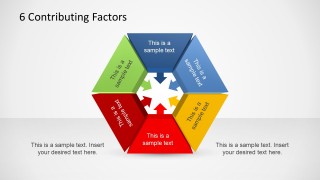
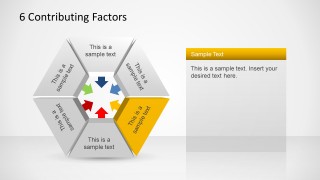
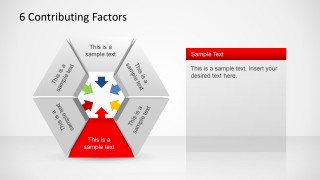
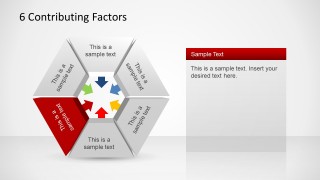
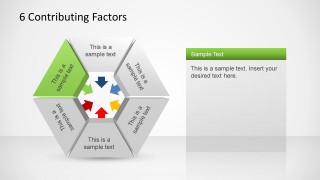
- A consultant can use the full six-factor hexagon to introduce the drivers of a client challenge before discussing each colored segment in the follow-up slides.
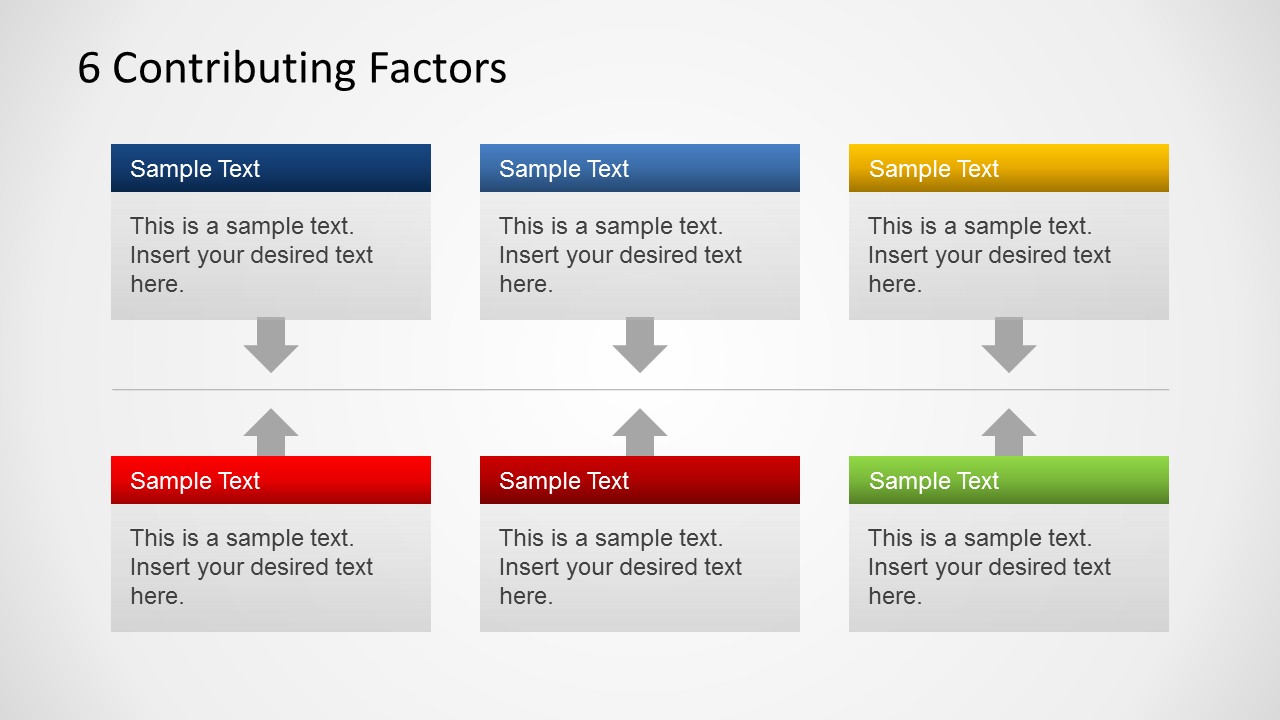
- A project manager can use the six-card relationship grid to compare risks, dependencies, or workstream inputs and show how each item connects to a shared outcome.
- An educator or trainer can use the circular hexagon diagram to teach a framework where six variables contribute to a central concept or decision.
Features
- 100% editable presentation template
- Compatible with Microsoft PowerPoint and Google Slides
- Scalable vector shapes, icons and illustrations
- AI-Ready for Microsoft Copilot and Claude
- Instant access and download
Frequently asked questions
Q: How should a presenter structure the explanation using this six-factor diagram?
A: Start with Slide 1 to show the full set of six factors at once, then move through the highlighted-factor slides to explain each input without visual clutter. Keep the central issue consistent across the deck, and use the right-side callout boxes for evidence, examples, or implications rather than repeating the factor label.
Q: Who is this template best suited for, and in what kind of discussion?
A: This template fits analysts, consultants, managers, and trainers who need to explain why an outcome is shaped by several related inputs. It works well for root cause reviews, risk discussions, decision criteria, service quality drivers, or teaching frameworks where six components are important but no single timeline is needed.
Q: Why use the hexagon and inward-arrow metaphor instead of a simple list?
A: The hexagon makes the six factors appear balanced and connected, while the inward arrows point attention toward the central outcome. That visual metaphor helps audiences understand contribution rather than sequence. The highlighted versions then reduce cognitive load by isolating one factor while preserving the context of the full system.



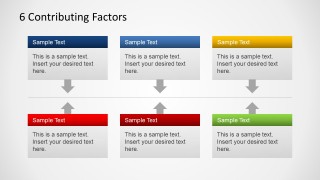
6 Contributing Factors Diagram Template for PowerPoint
8-slide PowerPoint diagram template for six-factor hexagon analysis and contributing factor callouts
The 6 Contributing Factors Diagram Template for PowerPoint is an 8-slide diagram deck for showing six causes linked to one central variable. It includes a six-part hexagon cycle, highlighted-factor callout slides, and a six-card relationship grid for consultants, analysts, managers, and educators preparing structured cause analysis in PowerPoint.


 Loading...
 Microsoft PowerPoint
  Microsoft Copilot
  Claude for PowerPoint
 Other formats supported
Subscribe today and get immediate
access to download our PowerPoint templates.