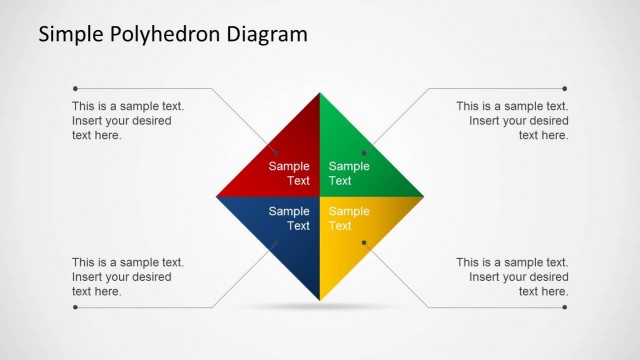
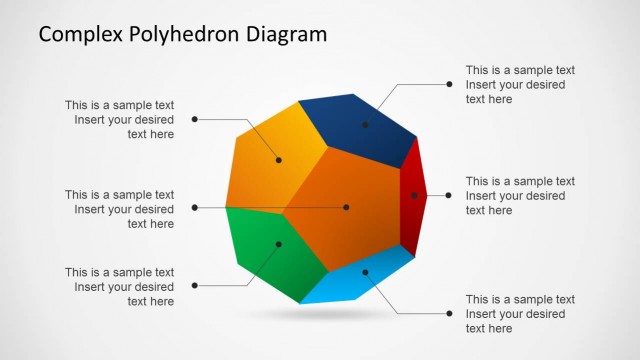
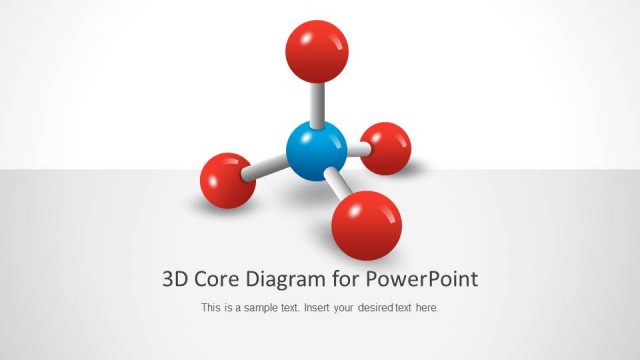
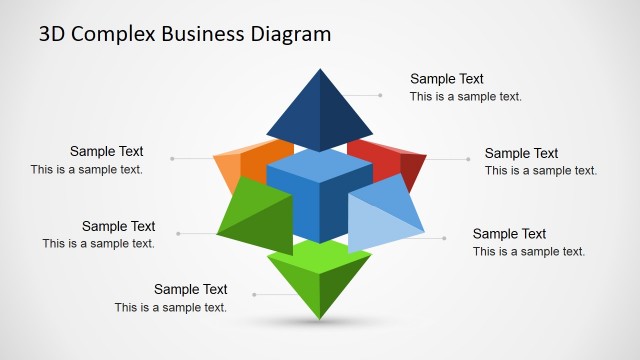
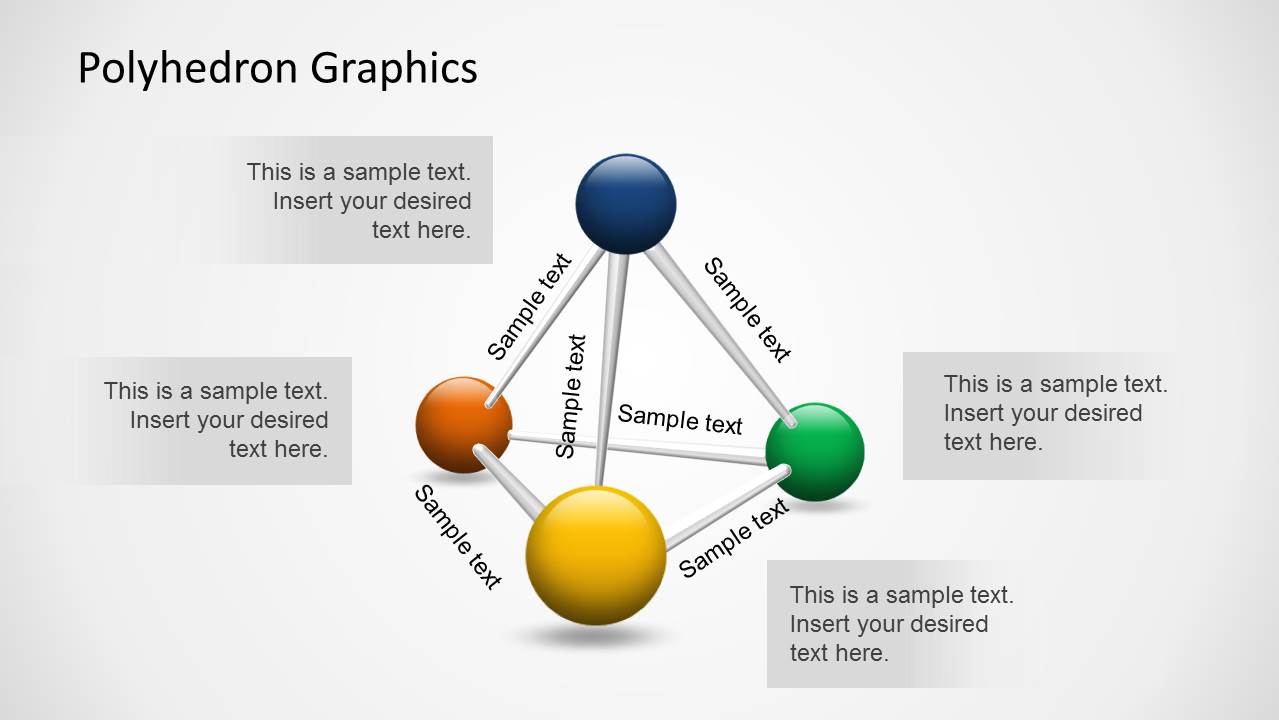
Polyhedron Diagram for PowerPoint is a 3D template with an attractive Polyhedron design for making PowerPoint Diagrams.
This template is among our collection of Polyhedron Diagram Templates for PowerPoint and comes with a 3D layout which is not only capable of accommodating complex bits of information but can also help you present that information in the form of a slide design which will not visually overwhelm your audience.
For more Polyhedron Diagram Templates, see the Complex Polyhedron and Simple Polyhedron templates for PowerPoint.
What’s inside this template
Example presentation scenarios
- A strategy consultant can explain how four business drivers connect by using the overview polyhedron diagram first, then assigning each highlighted-node content panel to one driver.
- A product manager can present relationships among platform components, using the colored spheres as modules and the edge labels to describe dependencies between them.
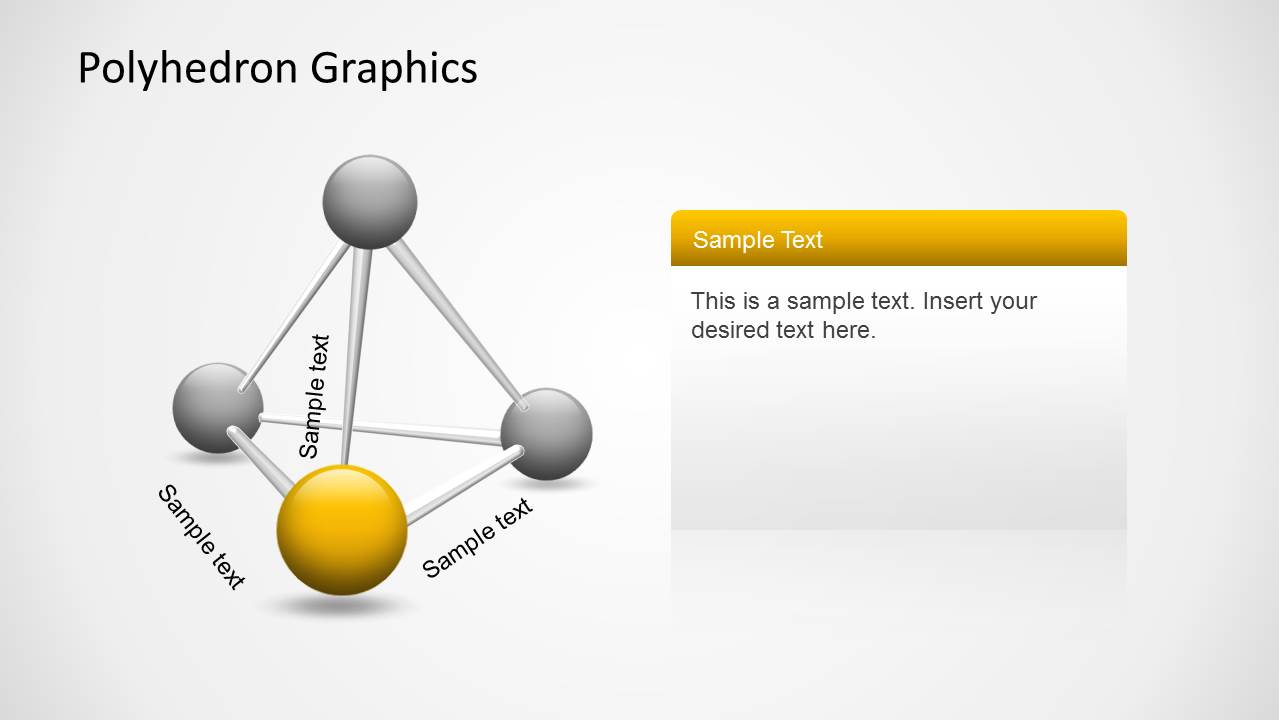
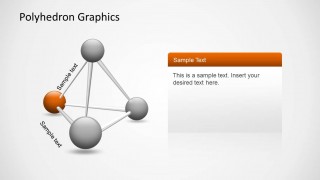
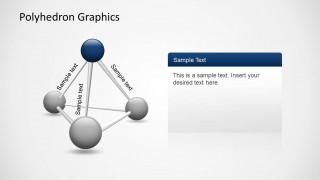
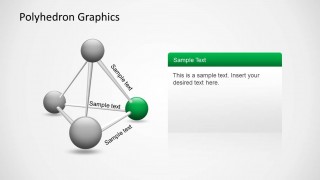
- An educator can teach a network or systems concept by showing the full polyhedron map, then walking learners through the yellow, orange, blue, and green focus-node slides.
- An operations leader can compare interconnected teams or process owners by placing names on the spheres and using the right-side content panels for responsibilities, risks, or decisions.
Features
- 100% editable presentation template
- Compatible with Microsoft PowerPoint and Google Slides
- Scalable vector shapes, icons and illustrations
- AI-Ready for Microsoft Copilot and Claude
- Instant access and download
Frequently asked questions
Q: How should a presenter explain the polyhedron diagram without making the relationships feel abstract?
A: Start by defining what each sphere represents before discussing the connecting rods. On the overview slide, keep the callouts short and use them to name the main relationship themes. Then move to the highlighted-node slides and explain one sphere at a time, using the right-side panel for the evidence, decision, or implication tied to that node.
Q: Who is this template best suited for in a business presentation?
A: This template fits presenters who need to explain a relationship model rather than a sequence or metric report. Consultants can map strategic drivers, product managers can show component dependencies, and analysts can describe interconnected factors. The four highlighted-node slides make it especially useful when each part needs a short explanation after the full model is introduced.
Q: Why use a 3D polyhedron metaphor instead of a flat list or standard matrix?
A: The polyhedron metaphor shows that the items are connected from several directions, not just arranged in a ranking or table. The rods make relationships visible, while the colored spheres create focal points. By graying out non-focus nodes on later slides, the design reduces distraction and helps the audience follow one relationship cluster at a time.



Polyhedron Diagram for PowerPoint
5-slide PowerPoint diagram template for polyhedron network relationships and highlighted node explanations
Polyhedron Diagram for PowerPoint is a 5-slide PowerPoint diagram template for explaining connected entities through a 3D polyhedron network. It includes a full relationship map with callouts plus four highlighted-node content panels with matching color headers. It suits consultants, analysts, educators, and technical presenters who need to show dependencies or clustered concepts.


 Loading...
 Microsoft PowerPoint
  Microsoft Copilot
  Claude for PowerPoint
 Other formats supported
Subscribe today and get immediate
access to download our PowerPoint templates.