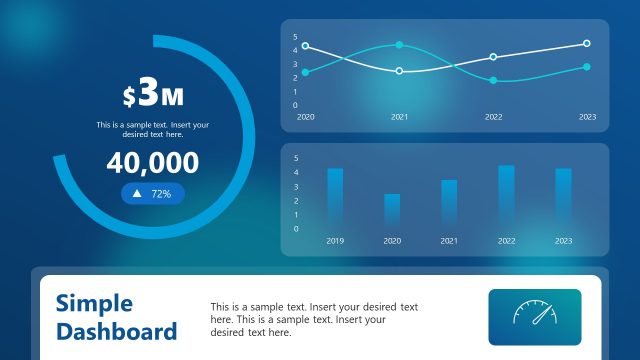
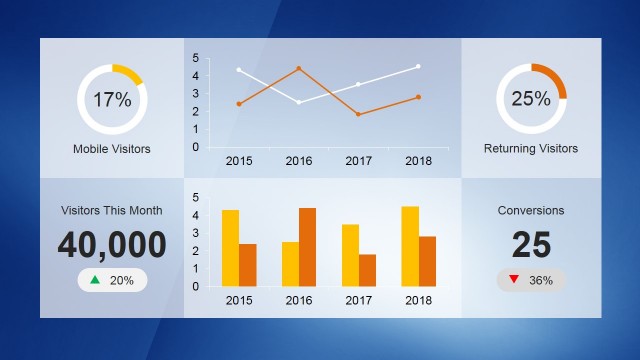
Simple Yearly Performance Dashboard PowerPoint Template
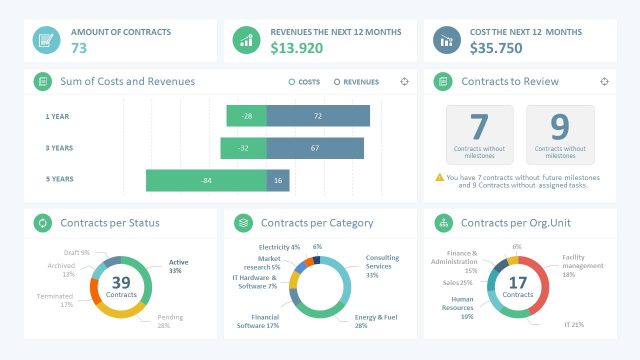
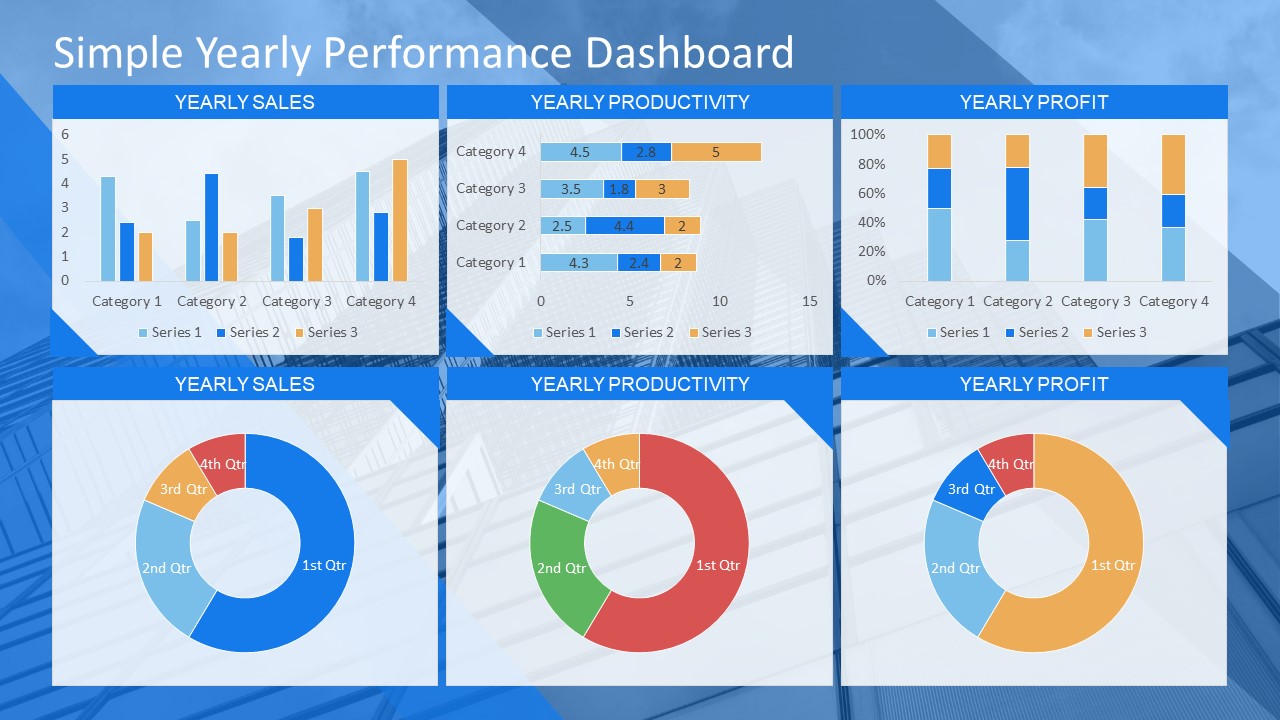
The Simple Yearly Performance Dashboard is a one slide layout of data charts. This slide has 6 segments shows different data-driven chart. These include multiple bar designs and doughnut charts. These are the graphical presentation of yearly sales, productivity, and profit. It is an effective method of displaying quantitative data so that viewers can understand performance statistics quickly. Dashboard template enables users to brief multiple statistics in one slide view. As a part of an annual report, the simple yearly performance dashboard enables users to display various KIPs. The key performance indicator may include analytics, trends, sales targets etc.
The Simple Yearly Performance Dashboard is an easy to edit template of data-driven charts. The benefit of data driven charts: PowerPoint will automatically adjust the design according to change in numerical values. Therefore, users can edit number and formulas in spreadsheet attached to chart and update its graphics. The users can find spreadsheet by selecting chart and click on funnel shape. There is “Select data” option in the bottom of funnel menu which opens a spreadsheet to enter numbers and formulas. Further, the background contains high-quality skyscraper image which gives an immediate idea of business presentation. But users can replace this image with different background colors or patterns.
The performance dashboard is a custom layout with editable text placeholders and shapes to present data and information. On the dashboard slide, the first row contains vertical and horizontal bar charts. While the second slide displays quarterly performance review in doughnut chart as a whole. A simple yearly performance dashboard assists the project team to present their performance and forecast future. Moreover, performance dashboard is a common management tool, and this PowerPoint aids to deliver similar concept through presentation. Just like the manager who pulls out reports on a dashboard to see the stats of sales, profits, performance, attendance etc.
You must be logged in to download this file.
DOWNLOAD- Category
- Template Backgrounds
- Rating


 Loading...
- Size
- 16x9
- Item ID
- 7777-01
- Colors
Subscribe today and get immediate
access to download our PowerPoint templates.