Slide 6 of 14 from Quarterly Management Review PowerPoint Template
Editable Quarterly Management Review PPT Template
KPI Dashboard for Quarterly Management Review
- Chart
- Dashboard Composite
- Kpi Reporting Slide
- 16:9
- 100% Editable
The KPI Dashboard Slide from the Quarterly Management Review PowerPoint Template offers a clear layout combining editable slides with charts and text boxes to visualize key performance indicators. This slide template supports business presentations by providing a structured summary of quarterly metrics, ideal for financial summaries, project updates, and performance reviews using vector icons and data-driven visuals.
What’s on This Slide
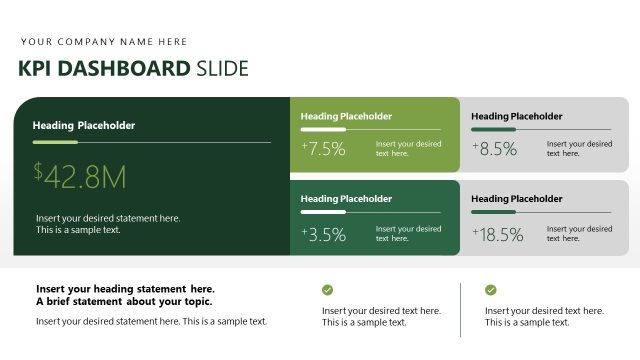
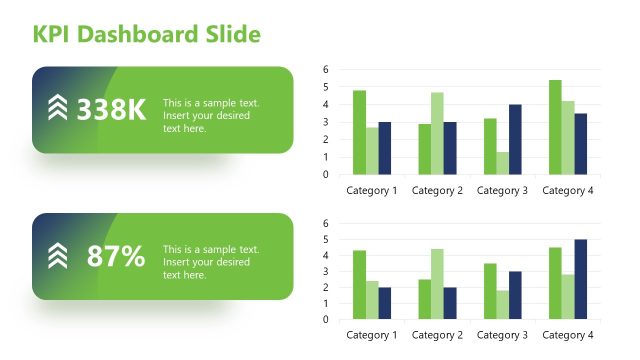
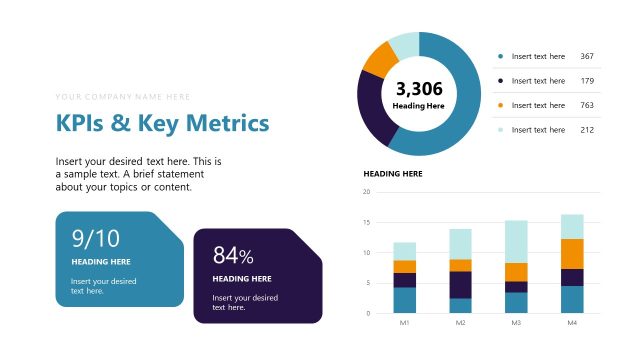
The layout features a combination of text boxes and charts. On the left, there are four rectangular containers arranged vertically, each containing a heading and a numerical value, with some having additional text placeholders below. The top right section displays a bar chart with four bars for each quarter, labeled Q1 to Q4, and color-coded series. Below the bar chart, there is a line chart with four data points for months M1 to M4. The overall composition is balanced, with a clear visual hierarchy emphasizing the KPI metrics and charts.
How to Use It
This layout serves as a KPI dashboard, effectively summarizing key performance indicators in a structured format. It fits within a quarterly management review presentation, allowing stakeholders to quickly assess performance metrics. This slide is suitable for business scenarios such as performance reviews, project updates, or financial summaries, where concise data visualization is essential for decision-making.
Text Placeholders & Capacity
Keep your copy within these limits so it fits without resizing. Node slots can accommodate multiple metrics, roughly 4-5 words each.
| Placeholder | Count | Max characters (approx.) |
|---|---|---|
| Slide title | 1 | 25 |
| Item heading | 4 | 15 |
| Item body | 4 | 50 |
| Chart title | 2 | 25 |
| Axis label | 4 | 10 |
Slide Keywords
Download unlimited PowerPoint templates, charts and graphics for your presentations with our annual plan.
DOWNLOAD