Slide 1 of 3 from Laffer Curves for PowerPoint
6072-06-concept-curves-laffer-1
Laffer Curve Diagram for Presentations
- Diagram
- Other
- Concept Explanation Slide
- 16:9
- 100% Editable
The Laffer Curve Diagram slide from the Laffer Curves for PowerPoint template offers a clear visual tool for economic presentations and tax policy discussions. This slide template features editable shapes and text placeholders designed to simplify complex concepts related to government revenue analysis. Ideal for use in corporate presentations or pitch deck templates, it supports effective communication of economic theories through professional slide templates.
What’s on This Slide
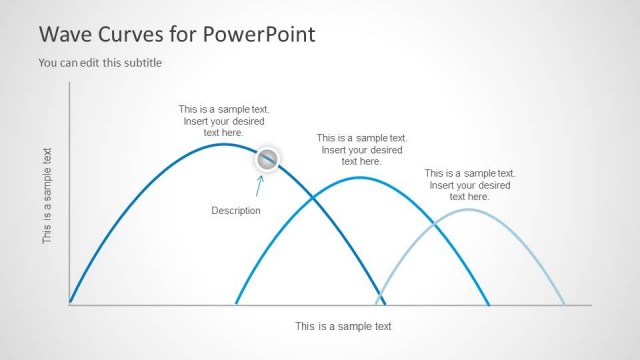
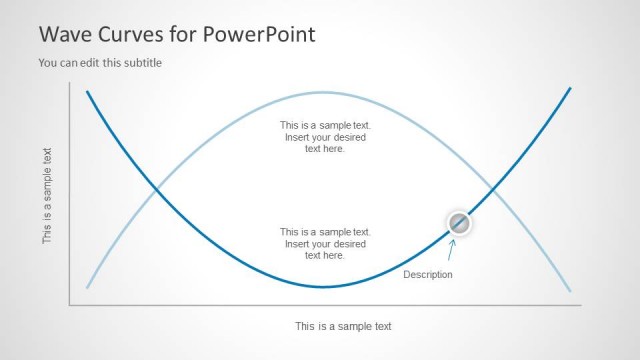
The layout features a large, semi-circular curve at the top, representing the Laffer curve, with a gradient fill transitioning from light to dark blue. Below, a smaller semi-circle in a lighter shade is positioned, also with a gradient. Text placeholders are situated along the curves and to the left, with one aligned vertically and others horizontally. The title is prominently displayed at the top, followed by a subtitle. Each text placeholder is clearly defined, allowing for easy insertion of content. Overall, the composition emphasizes the curves and provides ample space for annotations.
How to Use It
This layout serves as a visual representation of the Laffer curve, illustrating the relationship between tax rates and tax revenue. It is suitable for presentations discussing economic theories, tax policies, or government revenue strategies. This slide fits well at the beginning of a presentation to introduce key concepts or in a section focused on economic analysis. It can be used to explain complex ideas in a simplified manner, making it ideal for educational or professional settings.
Text Placeholders & Capacity
Keep your copy within these limits so it fits without resizing. Body slots can hold roughly 8-10 words each.
| Placeholder | Count | Max characters (approx.) |
|---|---|---|
| Slide title | 1 | 30 |
| Subtitle | 1 | 40 |
| Item body | 4 | 50 |
Slide Keywords
Download unlimited PowerPoint templates, charts and graphics for your presentations with our annual plan.
DOWNLOADReturn to Laffer Curves for PowerPoint.