Slide 2 of 3 from Laffer Curves for PowerPoint
6072-06-concept-curves-laffer-2
Laffer Curve Diagram for Presentations
- Diagram
- Other
- Concept Explanation Slide
- 16:9
- 100% Editable
The Laffer Curve Diagram slide from the Laffer Curves for PowerPoint template offers a clear visual explanation of tax rate and revenue relationships, ideal for economic presentations and educational content. This slide layout includes editable shapes and text placeholders that support detailed discussion on taxation concepts within a business presentation or policy pitch deck template.
What’s on This Slide
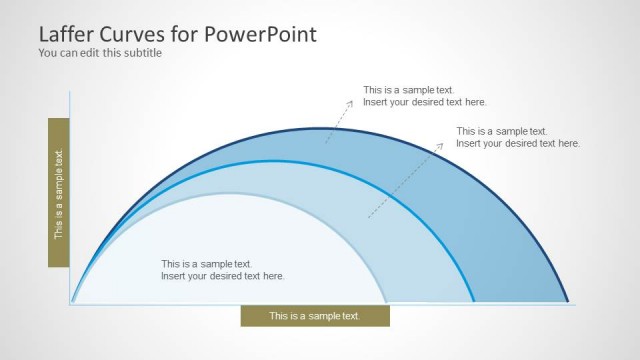
The slide features a curved line representing the Laffer curve, positioned centrally. There are four circular nodes along the curve, each containing a text placeholder for labels. The curve is flanked by two vertical text boxes on the left and right, each with a placeholder for additional text. The background is light with a subtle gradient, and the overall layout is structured to emphasize the curve's shape. The text placeholders are aligned horizontally and vertically, creating a balanced visual hierarchy.
How to Use It
This layout serves to illustrate the Laffer curve concept, making it suitable for discussions on taxation and economic theory. It fits well in a sequence following introductory content, providing a visual representation of the relationship between tax rates and revenue. This structure is useful in educational settings, policy discussions, or economic presentations, where visualizing complex relationships enhances understanding.
Text Placeholders & Capacity
Keep your copy within these limits so it fits without resizing. Node labels can hold about 30 characters each, while body text slots are tighter at around 40 characters.
| Placeholder | Count | Max characters (approx.) |
|---|---|---|
| Item heading | 4 | 30 |
| Body paragraph | 5 | 40 |
Slide Keywords
Download unlimited PowerPoint templates, charts and graphics for your presentations with our annual plan.
DOWNLOADReturn to Laffer Curves for PowerPoint.