Slide 3 of 3 from Laffer Curves for PowerPoint
6072-06-concept-curves-laffer-3
Laffer Curve Overview Slide
- Diagram
- Other
- Concept Explanation Slide
- 16:9
- 100% Editable
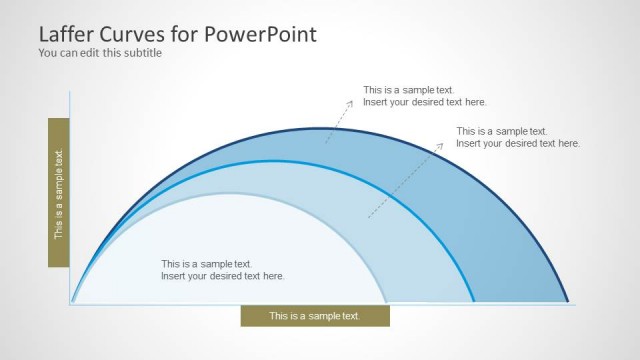
The Laffer Curve Overview slide from the Laffer Curves for PowerPoint template provides a clear visual diagram ideal for economic theory presentations and tax policy discussions. This slide layout uses editable shapes and vector icons to illustrate the relationship between tax rates and revenue, making it suitable for business presentations and government strategy meetings. Its design supports concise explanation of complex financial concepts within a corporate presentation or pitch deck template.
What’s on This Slide
The layout features a large arc diagram positioned centrally, representing the Laffer Curve. Below the arc, there are four rectangular text placeholders arranged in two rows and two columns. Each placeholder is aligned to the left and right of the arc, with the top row containing two placeholders and the bottom row containing two as well. The arc is drawn in a smooth curve with circular nodes indicating key points. The background is light gray, and the text placeholders have a white background with a subtle border, creating a clear visual hierarchy.
How to Use It
This layout serves as a visual representation of the Laffer Curve, illustrating tax revenue against tax rates. It fits within a presentation discussing economic theories or tax policies, particularly in government or financial contexts. It is suitable for scenarios where visualizing relationships between variables is essential, such as tax implications or economic models. This slide can be used to summarize key points or findings related to the Laffer Curve in a concise manner.
Text Placeholders & Capacity
Keep your copy within these limits so it fits without resizing. Node body slots can hold about 8 words each.
| Placeholder | Count | Max characters (approx.) |
|---|---|---|
| Item body | 4 | 40 |
| Slide title | 1 | 50 |
| Subtitle | 1 | 50 |
Slide Keywords
Download unlimited PowerPoint templates, charts and graphics for your presentations with our annual plan.
DOWNLOADReturn to Laffer Curves for PowerPoint.