Slide 1 of 7 from Wave Curves for PowerPoint
6072-03-concept-curves-waves-1
Wave Curve Diagram for Presentations
- Diagram
- Other
- Concept Explanation Slide
- 16:9
- 100% Editable
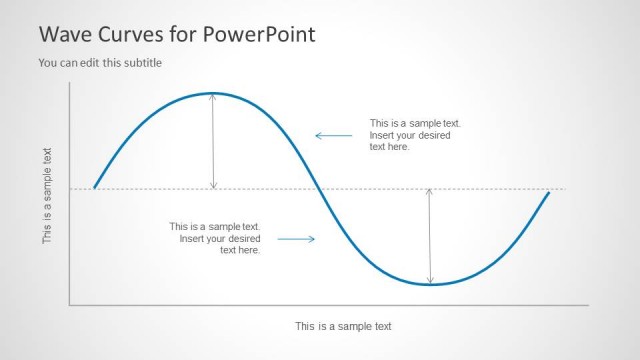
The Wave Curve Diagram slide from the Wave Curves for PowerPoint template offers a clear visual tool for explaining wave phenomena and signal processing concepts. This slide layout features editable shapes and vector icons that enhance the presentation of sinusoidal patterns, making it suitable for technical and educational business presentations or pitch deck templates focused on mathematical and engineering topics.
What’s on This Slide
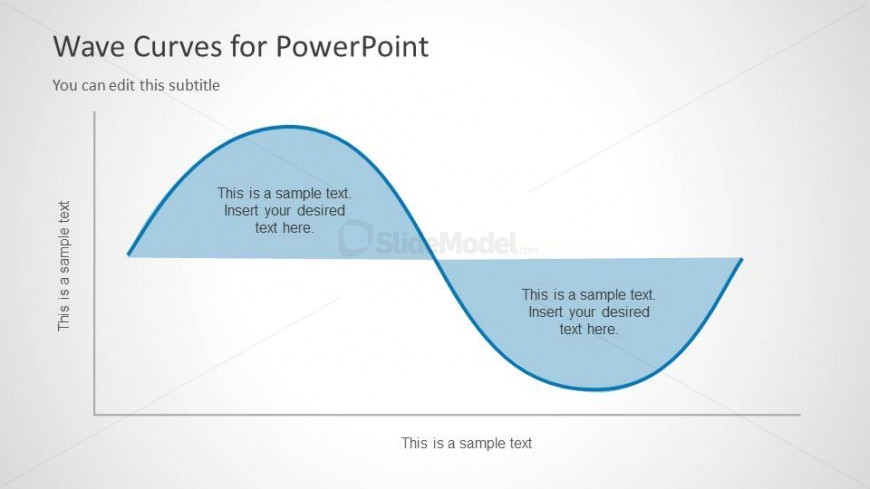
The slide features a wave curve diagram with two peaks and a trough. The curve is colored in blue and spans horizontally across the center. Text placeholders are positioned at the top, bottom, and within the curve, aligned to the left and right. Each placeholder contains sample text indicating where to insert desired content. The background is a light gradient, enhancing the visibility of the curve. The overall layout is symmetrical, with the curve dominating the central area, creating a clear visual hierarchy.
How to Use It
This layout serves as a visual representation of wave patterns, suitable for explaining concepts in physics or engineering. It fits well in a presentation sequence that introduces wave phenomena or mathematical concepts. Real-world applications include discussions on signal processing, oscillations, or frequency analysis. The layout can be used to illustrate relationships between variables in a sinusoidal context, making it effective for educational or technical presentations.
Text Placeholders & Capacity
Keep your copy within these limits so it fits without resizing. Body slots can hold approximately 10-12 words each.
| Placeholder | Count | Max characters (approx.) |
|---|---|---|
| Slide title | 1 | 30 |
| Subtitle | 1 | 30 |
| Body paragraph | 3 | 50 |
Slide Keywords
Download unlimited PowerPoint templates, charts and graphics for your presentations with our annual plan.
DOWNLOADReturn to Wave Curves for PowerPoint.