Slide 12 of 18 from Market Share Diagrams for PowerPoint
6168-01-market-share-diagrams-12
Market Share Line Chart for PowerPoint
- Chart
- Line Chart
- Evaluation Slide
- 16:9
- 100% Editable
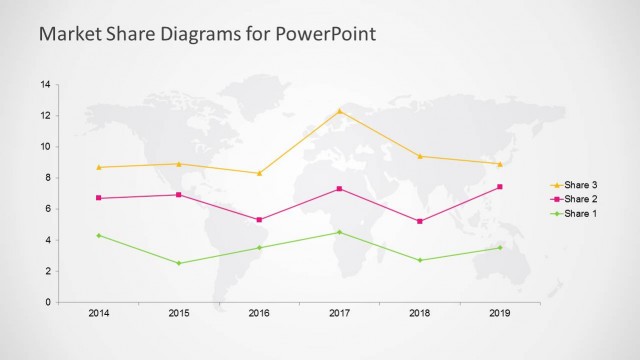
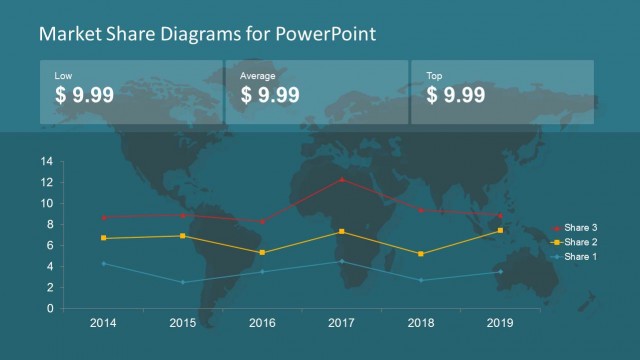
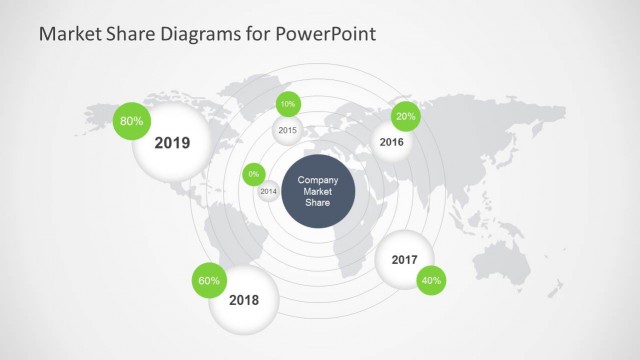
The Market Share Line Chart slide from the Market Share Diagrams for PowerPoint template provides a clear visualization of market trends over time. This slide layout is designed for business presentations requiring detailed market analysis and competitive evaluation. Featuring editable shapes and vector icons, it supports effective communication of performance metrics in corporate presentations and pitch deck templates.
What’s on This Slide
The slide features a line chart positioned centrally against a dark blue background. The chart displays three lines representing different market shares over time, with years labeled along the horizontal axis and share values along the vertical axis. Each line is color-coded: orange for Share 3, blue for Share 2, and green for Share 1. Data points are marked with distinct shapes at each year. The title is placed at the top center, while the chart occupies most of the slide space, ensuring clear visibility of trends.
How to Use It
This layout serves as a time-series analysis tool, ideal for illustrating market share trends across multiple years. It fits well in a presentation sequence following a market overview or competitive analysis. This slide is suitable for business scenarios such as quarterly reports, market research presentations, or strategic planning sessions where tracking changes in market share is essential. It can effectively communicate performance metrics to stakeholders.
Text Placeholders & Capacity
Keep your copy within these limits so it fits without resizing. Chart title and axis labels have limited space, roughly 2-3 words each.
| Placeholder | Count | Max characters (approx.) |
|---|---|---|
| Chart title | 1 | 40 |
| Axis label | 2 | 20 |
| Data label | 3 | 10 |
Slide Keywords
Download unlimited PowerPoint templates, charts and graphics for your presentations with our annual plan.
DOWNLOADReturn to Market Share Diagrams for PowerPoint.