Slide 10 of 18 from Market Share Diagrams for PowerPoint
6168-01-market-share-diagrams-10
Market Share Distribution Diagram for Presentations
- Diagram
- Radial Hub
- Strategic Analysis Slide
- 16:9
- 100% Editable
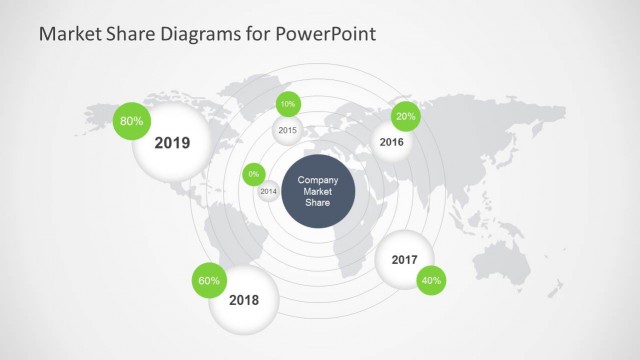
The Market Share Distribution slide from the Market Share Diagrams for PowerPoint template offers a radial hub diagram ideal for strategic analysis. This slide layout uses editable shapes and vector icons to visually represent market share trends over time, making it suitable for business presentations focused on competitive landscape and market analysis. Its design supports clear communication of market dynamics within a corporate presentation or pitch deck template.
What’s on This Slide
The slide features a world map background in dark gray. Central to the design is a teal circle labeled 'Company Market Share.' Surrounding this are six white circles, each containing a percentage and a year, positioned at varying distances from the center, indicating market share over time. The circles are connected by concentric circular lines, creating a radial layout. The visual hierarchy emphasizes the central label, while the outer circles are smaller and less prominent. Text placeholders exist for the title and subtitle, aligned at the top.
How to Use It
This layout serves as a visual representation of market share over several years, suitable for illustrating trends in competitive analysis. It fits well in a presentation sequence following a problem slide, providing context before discussing strategies. Ideal for business scenarios such as market analysis, investor presentations, or strategic planning discussions, this diagram effectively communicates changes in market presence over time.
Text Placeholders & Capacity
Keep your copy within these limits so it fits without resizing. Node labels can accommodate about 10 characters each.
| Placeholder | Count | Max characters (approx.) |
|---|---|---|
| Slide title | 1 | 30 |
| Item heading | 6 | 10 |
| Item body | 6 | 10 |
Slide Keywords
Download unlimited PowerPoint templates, charts and graphics for your presentations with our annual plan.
DOWNLOADReturn to Market Share Diagrams for PowerPoint.