Slide 3 of 18 from Market Share Diagrams for PowerPoint
6168-01-market-share-diagrams-3
Market Share Line Chart for PowerPoint
- Chart
- Line Chart
- Comparison Slide
- 16:9
- 100% Editable
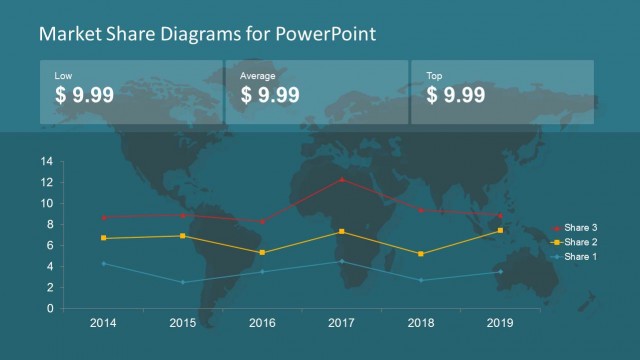
The Market Share Line Chart slide from the Market Share Diagrams for PowerPoint template offers a clear visualization of competitive trends using editable slides with vector icons and distinct data markers. Ideal for business presentations, this slide supports detailed market share analysis and trend comparison over time, enhancing corporate presentations and pitch deck templates with professional slide templates.
What’s on This Slide
The slide features a line chart overlaid on a world map background. The chart displays four lines representing different market shares, each distinguished by unique colors: yellow for Share 3, pink for Share 2, and green for Share 1. Data points are marked with distinct shapes: triangles for Share 3, squares for Share 2, and diamonds for Share 1. The x-axis represents years from 2014 to 2019, while the y-axis indicates market share values from 0 to 14. Text placeholders exist at the top for the title and at the bottom for additional notes.
How to Use It
This layout serves as a comparative analysis tool for market share trends over time. It is effective in presentations that discuss market dynamics, competitive positioning, or performance metrics. This slide fits well after a problem framing slide, providing a visual representation of market changes. It can be used in business meetings, marketing strategy discussions, or investor presentations to illustrate growth or decline in market shares across different entities.
Text Placeholders & Capacity
Keep your copy within these limits so it fits without resizing. Title and chart title slots can accommodate roughly 5-7 words each.
| Placeholder | Count | Max characters (approx.) |
|---|---|---|
| Slide title | 1 | 30 |
| Chart title | 1 | 30 |
Slide Keywords
Download unlimited PowerPoint templates, charts and graphics for your presentations with our annual plan.
DOWNLOADReturn to Market Share Diagrams for PowerPoint.