Financial Report PowerPoint Template
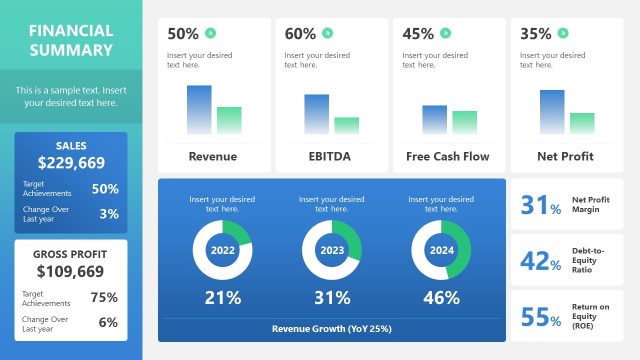
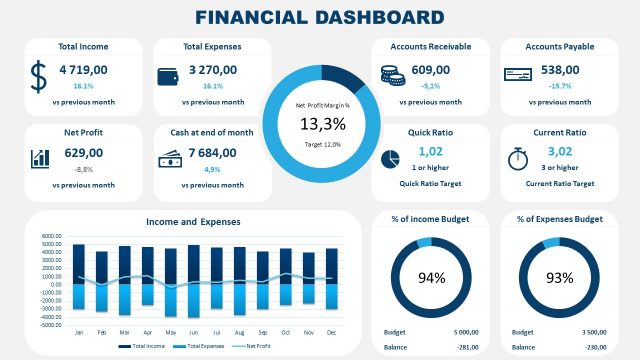
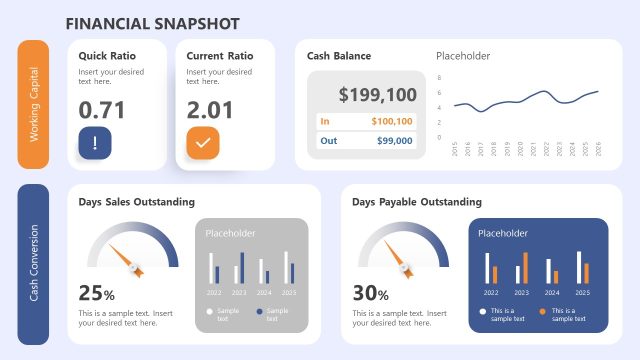
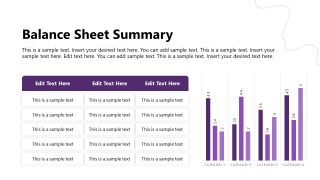
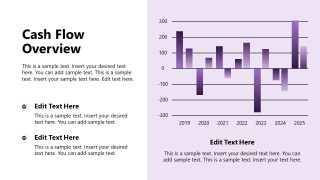
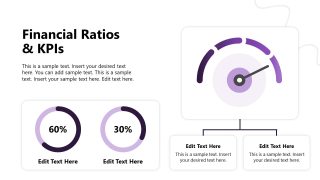
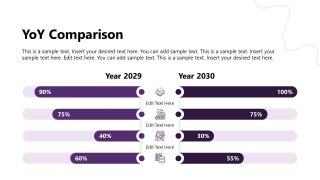
Summarize your organization’s financial performance, including gains and losses, for stakeholders with our Financial Report PowerPoint Template. A financial report enables decision-makers to understand the complexities and identify areas for improvement by analyzing data trends and insights. With this slide template, professionals can effectively showcase a balance sheet summary, cash flow overview, financial ratios, key performance indicators, and other key data points. Moreover, the year-over-year (YoY) comparison slide enables professionals to compare two consecutive business years. We created this best PPT template for financial experts, data analysts, and related personnel.
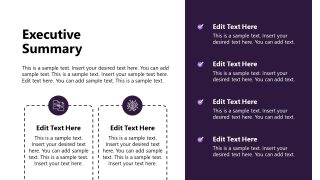
The Financial Report PowerPoint Template has a dark purple gradient design and a highly professional layout. You can adjust the template’s graphical arrangement with other versions of Microsoft PowerPoint, Google Slides, and Keynote. The financial report template begins with an engaging cover slide featuring a curved line graph in the background. Then, an executive summary slide allows professionals to summarize all the essential information and present it in an organized manner to stakeholders and board members. Our financial report PPT template is enriched with editable and attractive data visualization.
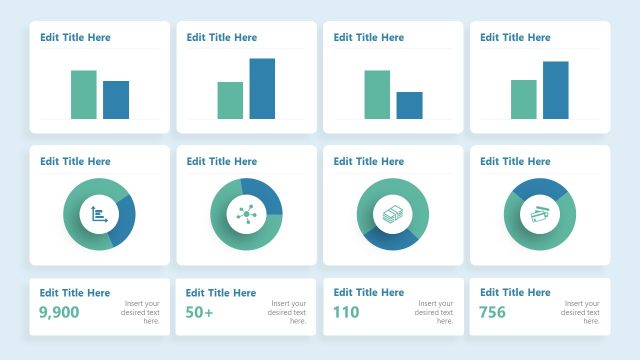
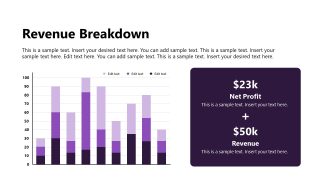
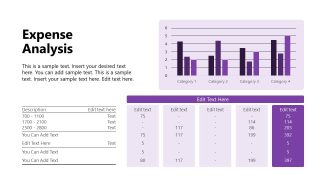
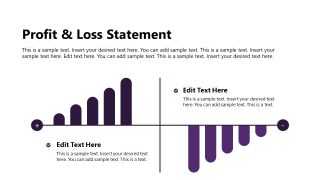
The data charts enable users to present complex data relationships and insights in an easy-to-understand format. Initially, you can showcase the revenue breakdown using a multi-label column chart. Then, we provided a tabular layout showing the expense analysis report. The profit and loss statement slide features a quadrant diagram to depict profits and losses visually. You can modify the types of charts, colors, and other items used in the template to fit your needs. Download the financial report presentation slide template and personalize it today!<


You must be logged in to download this file.
DOWNLOAD- Category
- Business PowerPoint Templates
- Rating


 Loading...
- Size
- 16x9
- Item ID
- 77209-01
Subscribe today and get immediate
access to download our PowerPoint templates.