Slide 2 of 3 from 3D Pie & Bar Charts for PowerPoint
6096-01-pie-with-bar-chart-2
3D Pie Chart for PowerPoint Presentation
- Chart
- Pie Chart
- Evaluation Slide
- 16:9
- 100% Editable
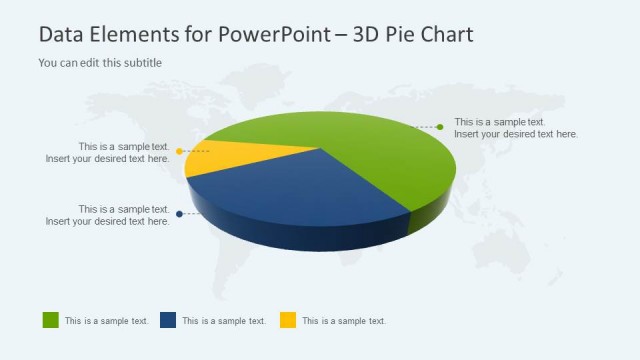
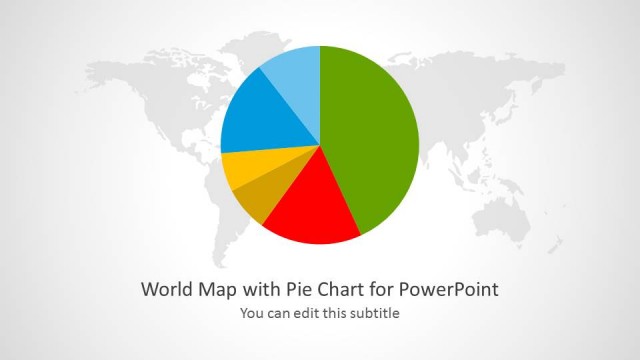
The 3D Pie Chart with World Map slide from the 3D Pie & Bar Charts for PowerPoint template offers a clear visual for market share analysis and demographic breakdowns. This slide layout integrates editable shapes and vector icons with a subtle global map background, enhancing business presentations and pitch deck templates focused on statistical data. Designed for effective data visualization, it supports clear communication of complex information in corporate presentations.
What’s on This Slide
The layout features a large 3D pie chart positioned centrally, displaying segments in green, blue, red, and yellow, with percentage labels on each segment. To the right, there is a text area containing sample text placeholders arranged vertically, aligned to the top and center of the section. A subtle world map background is visible, enhancing the global context of the data. The title is placed at the top left, with a subtitle directly beneath it. The overall composition balances the chart and text, creating a clear visual hierarchy.
How to Use It
This layout serves as a data visualization tool, effectively presenting statistical information through a 3D pie chart. It is suitable for business presentations where data comparison is essential, such as market share analysis or demographic breakdowns. Positioned as the second slide, it follows an introductory slide and precedes a bar chart slide, maintaining a logical flow in a data-driven presentation. This structure is ideal for analysts and managers aiming to convey insights clearly.
Text Placeholders & Capacity
Keep your copy within these limits so it fits without resizing. Body slots can accommodate roughly 10-12 words each.
| Placeholder | Count | Max characters (approx.) |
|---|---|---|
| Slide title | 1 | 30 |
| Subtitle | 1 | 30 |
| Item heading | 4 | 5 |
| Body paragraph | 4 | 50 |
Slide Keywords
Download unlimited PowerPoint templates, charts and graphics for your presentations with our annual plan.
DOWNLOADReturn to 3D Pie & Bar Charts for PowerPoint.