Simple Social Media Dashboard Template for PowerPoint
The Simple Social Media Dashboard Template for PowerPoint is an engaging dashboard slide for presenting social media analytics on a single page. Social media analytics are real-time data values that estimate how your channel or account grows and reaches the target audience. Social media managers and agencies regularly monitor these metrics and follow up to enhance the interactions. These metrics include followers, comments, likes, shares, and impressions. We have designed this 100% editable dashboard slide for presenting these analytical values before clients or team members. Professionals can edit the text boxes and graphs to discuss their content insights. It can also be used for meetings to plan better marketing and content strategies to grow social media platforms. The slide template can also be edited to showcase the market trends, traffic, and visitors.
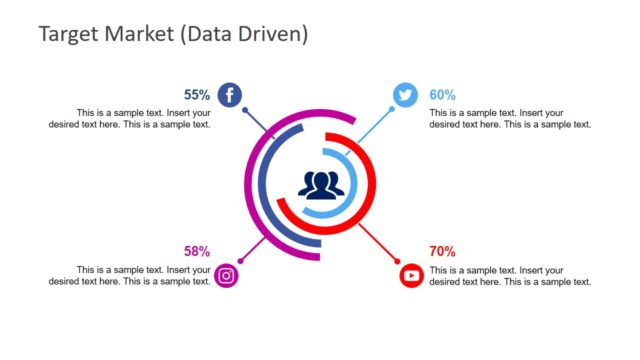
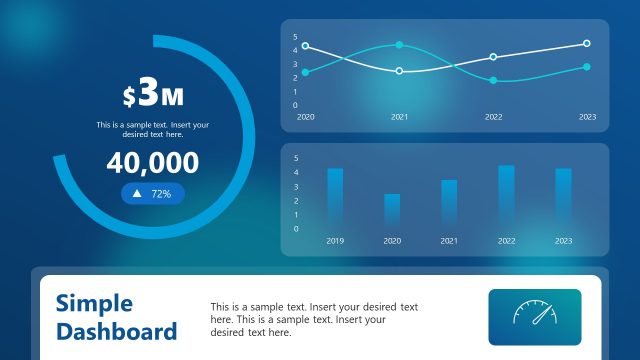
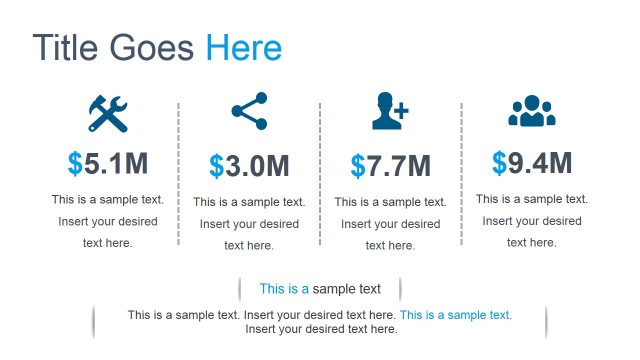
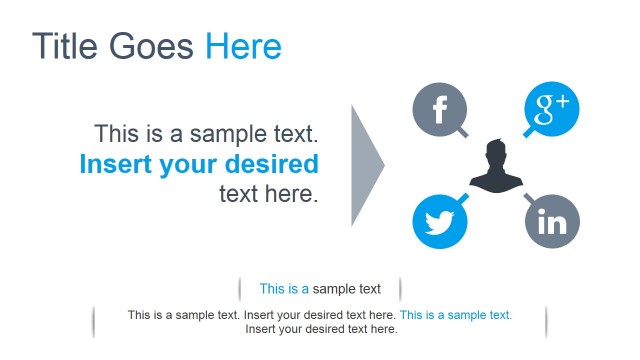
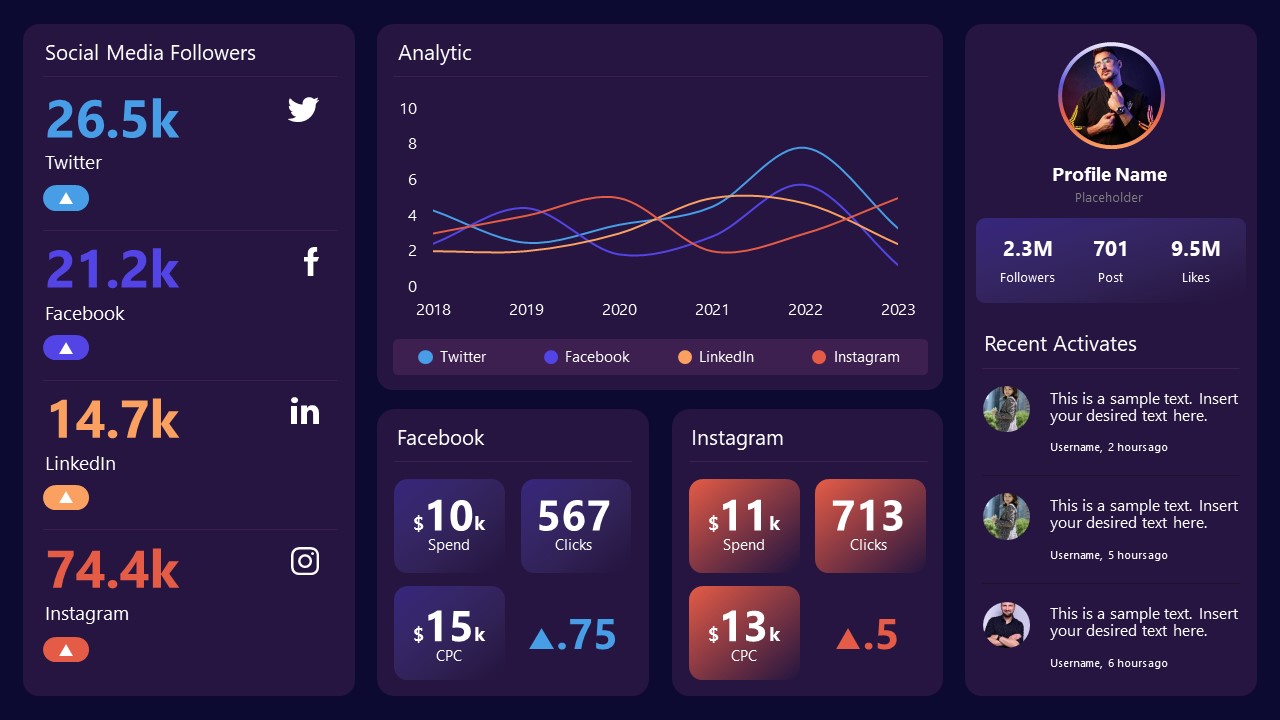
Our Simple Social Media Dashboard Template for PowerPoint has two editable slides that vary for the arrangement of various segments. The first slide of this PPT template is divided into three vertical sections. On the left-hand side, there are four social media icons and bold numerics to mention the overall followers status of each platform. The numbers are color-coded according to the social media icon colors. In the second part, there is a line data-driven line graph to display the growth or working of the platforms. Presenters can insert their values and change the colors of the reference lines. There are two square boxes to mention the details like clicks, CPC values, and impressions. The third segment provides the space to add recent activities, profile name & picture, and summary values for the number of followers, likes, and posts.
The following slide of this social media dashboard carries similar segments but varies for their organization. For instance, on this slide, users can mention the activities on the left-hand side and showcase the analytics using the bar graph instead of the line chart. The dark background color can be replaced with the colors of the presenter’s choice. Both slides can be edited with all PowerPoint versions, Google Slides, and Keynote. So, download and try it now! For more information, we have created an article about data presentations.


You must be logged in to download this file.
DOWNLOAD- Category
- Data & Charts
- Rating

 Loading...
- Size
- 16x9
- Item ID
- 21827-01
- Colors
Subscribe today and get immediate
access to download our PowerPoint templates.