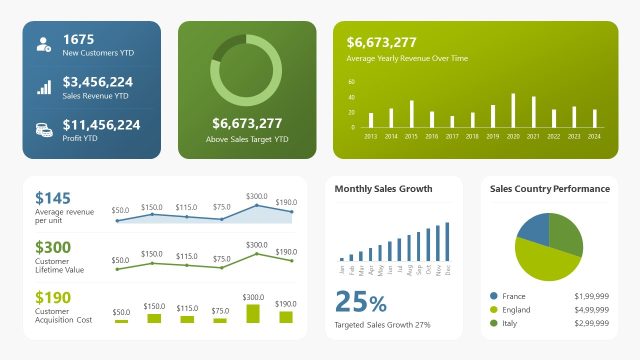
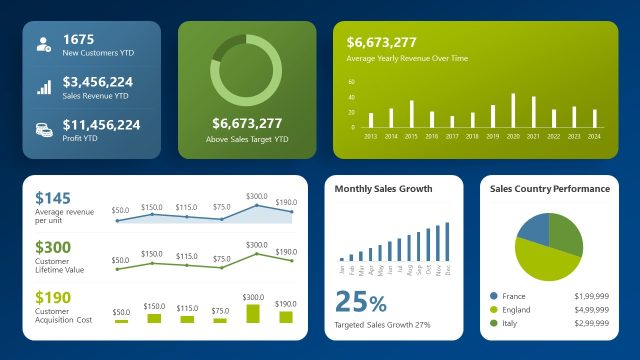
Regional Metrics and Financial Performance Gauges
![The Regional & Financial performance Slide is an important component of the Digital Marketing Dashboard. It has three main widgets described in the following paragraphs. The Top countries widget, presents a World Heat Map, with stronger colors in the countries with higher traffic. The world map widget is completely created using Editable PowerPoint Map shapes. […]](https://slidemodel.com/wp-content/uploads/8117-digital-marketing-dashboard_16x9-2-870x489.jpg)
The Regional & Financial performance Slide is an important component of the Digital Marketing Dashboard. It has three main widgets described in the following paragraphs.
The Top countries widget, presents a World Heat Map, with stronger colors in the countries with higher traffic. The world map widget is completely created using Editable PowerPoint Map shapes. The user can edit each country individually, allowing to fully customize the report.
The New vs Returning Widget, contains the Top 10 Countries, identified by their flag icon, and presents a bar chart with the percentage of new visitors versus returning visitors. This metric is essential for understanding the behaviour of the traffic received.
The Financial Widgets are created with a Gauge chart, describing the number in revenues and profits. This simple charts says a lot of the performance of the campaigns and digital products itself.
Combine this slide with additinoal financial performance data using some of our PowerPoint Tables or Dashbords