Digital Campaigns Management Key Performance Indicators
![The Digital Campaigns Management Key Performance Indicators contains an impressive area and line chart for comparing two dimensions of the digital marketing campaigns. In this case, Impressions versus Click Through Rate (CTR) which is a KPI for measuring how much clicks that the campaign receives compared against how much times is shown to users. The […]](https://cdn2.slidemodel.com/wp-content/uploads/8117-digital-marketing-dashboard_16x9-3-870x489.jpg)
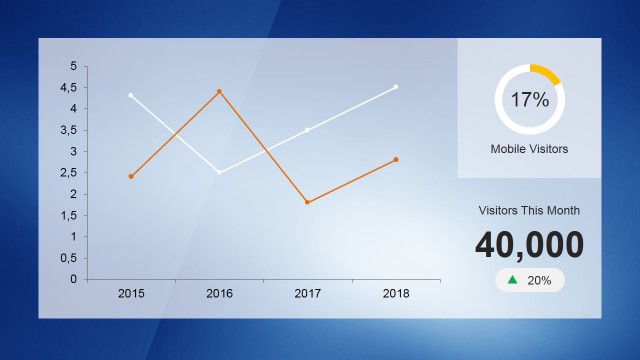
The Digital Campaigns Management Key Performance Indicators contains an impressive area and line chart for comparing two dimensions of the digital marketing campaigns. In this case, Impressions versus Click Through Rate (CTR) which is a KPI for measuring how much clicks that the campaign receives compared against how much times is shown to users.
The chart is created using PowerPoint Charts, and is completely data driven. The styles can be updated with PowerPoint chart tools featuring all the power of Excel for importing and manipulating data. The chart style resembles AdWords reports, being very visual and know by executives.
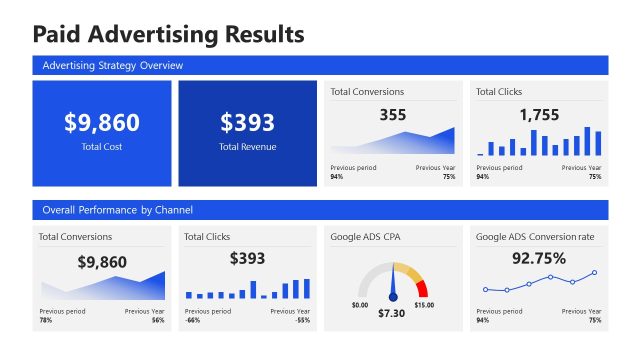
The bottom widget contains a Table with Three campaigns and some KPI’s. The table is created as a PowerPoint table, allowing the user to customize every property.