Slide 5 of 6 from Decision Tree Diagram for PowerPoint
6108-01-decision-tree-diagram-5
Decision Tree Diagram for PowerPoint
- Diagram
- Tree Hierarchy
- Process Slide
- 16:9
- 100% Editable
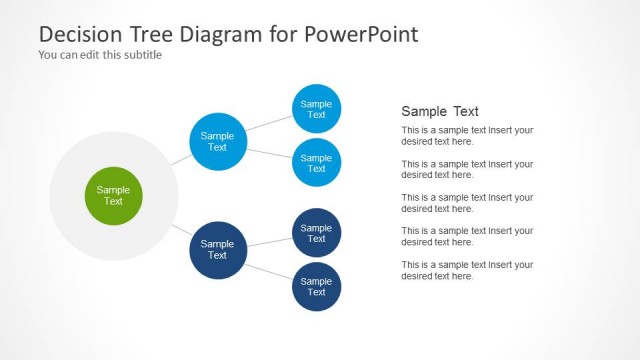
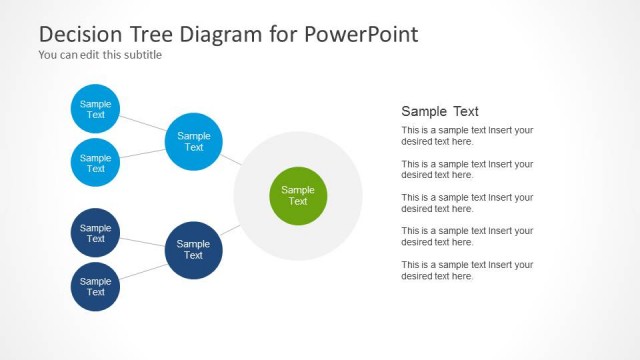
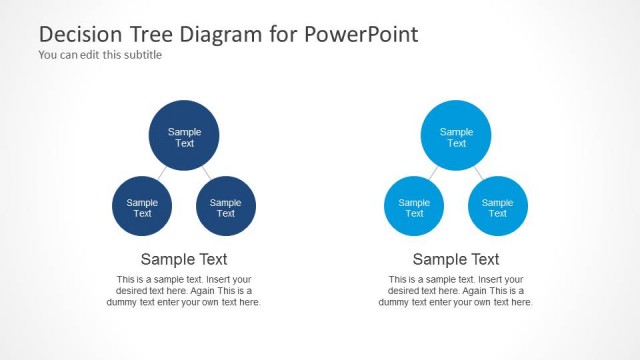
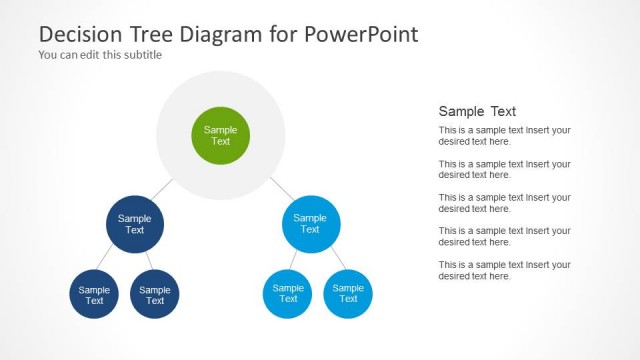
The Decision Tree Diagram slide from the Decision Tree Diagram for PowerPoint template offers a clear visual hierarchy ideal for mapping decision-making processes and organizational structures. This slide layout supports strategic planning by using editable shapes and vector icons to illustrate complex relationships effectively within a business presentation or pitch deck template.
What’s on This Slide
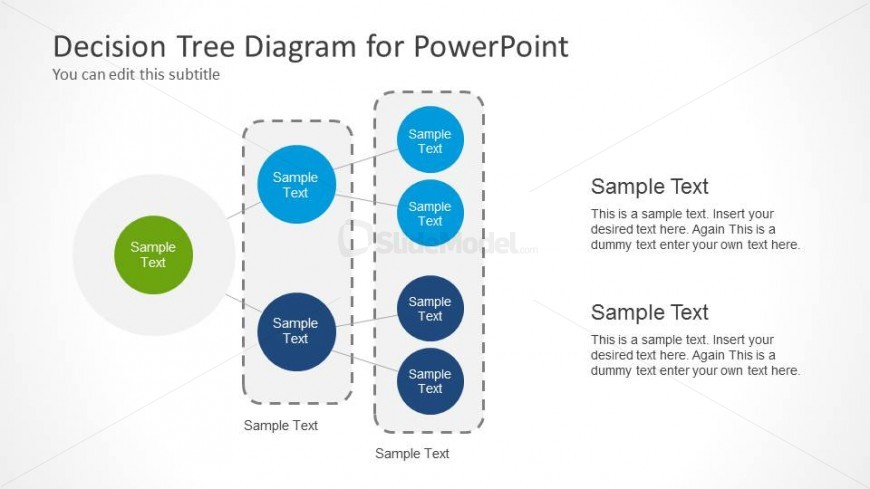
The layout features a central circular node at the bottom left, colored green with a text placeholder. Above it, there are two vertical columns of circular nodes, each colored blue, with text placeholders inside. The left column has three nodes, while the right column has two nodes. Each node is connected by dashed lines to the central node. To the right, there are two rectangular containers with text placeholders, aligned vertically. The overall composition is organized with clear visual hierarchy and spacing between elements, using a light background.
How to Use It
This layout serves as a decision tree diagram, illustrating decision-making processes or options. It fits well in presentations discussing strategic choices, project planning, or organizational structures. It can be used to visualize complex relationships or hierarchies in a clear manner. This structure is effective in business scenarios where decisions need to be mapped out visually, aiding in understanding and communication.
Text Placeholders & Capacity
Keep your copy within these limits so it fits without resizing. Node body slots can accommodate roughly 15-20 words each.
| Placeholder | Count | Max characters (approx.) |
|---|---|---|
| Slide title | 1 | 30 |
| Subtitle | 1 | 50 |
| Item heading | 5 | 20 |
| Item body | 5 | 100 |
Slide Keywords
Download unlimited PowerPoint templates, charts and graphics for your presentations with our annual plan.
DOWNLOADReturn to Decision Tree Diagram for PowerPoint.