Crossing the Chasm Slide Design
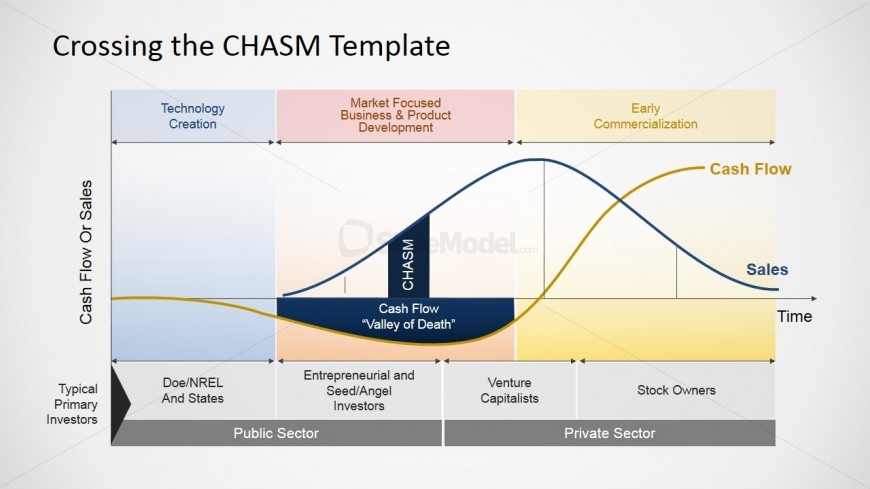
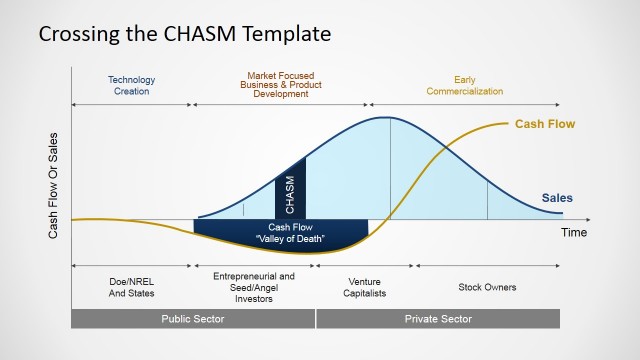
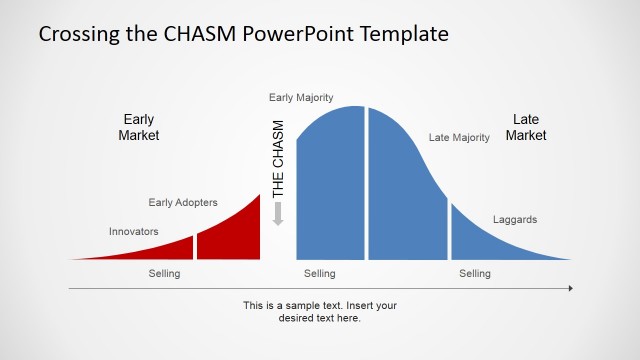
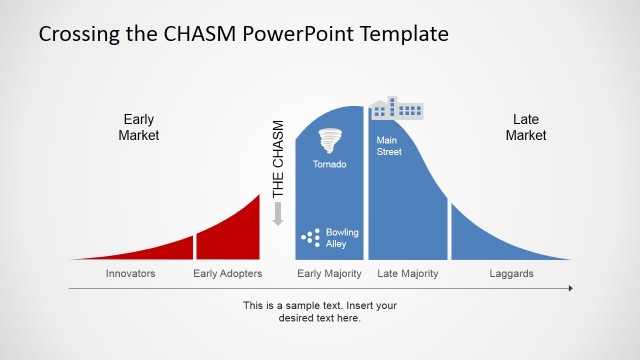
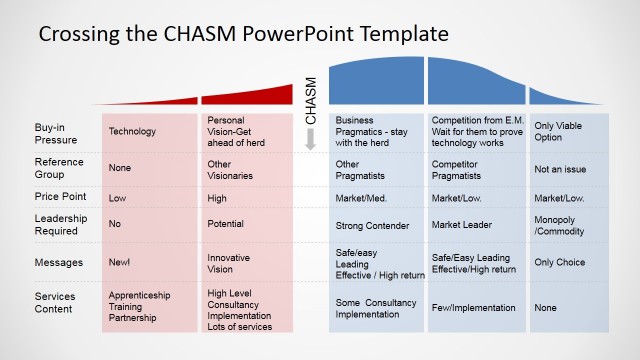
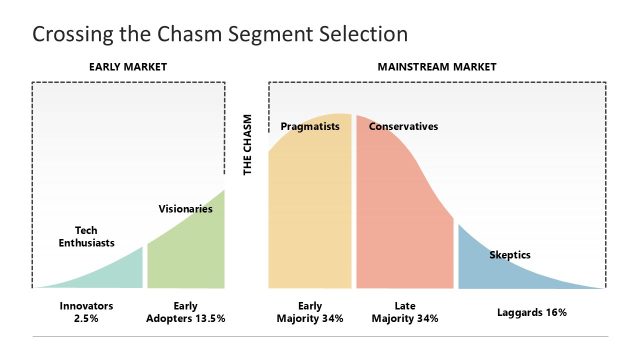
The Crossing the Chasm Slide Design presents the technology adoption curve and shows the concept of the Chasm. This curve shows the relationship between the public and private sectors in the evolution of a high technology idea, from an entrepreneurial idea into a well stablished mainstream product. The Sales and Cash Flow curves are placed in order to visually show their relationship.
These are presented through a graph found at the center of the PowerPoint slide. It shows a bell curve and a line graph, the gap between which is labeled as the chasm. The graph is also divided into three segments. These are distinguished through different colors – blue, red, and yellow. The PowerPoint objects are 100% editable. They can be edited to suit the presenter’s needs and preferences.
Return to Crossing The Chasm Slides for PowerPoint.