Crossing The Chasm Slides for PowerPoint – The Crossing The Chasm term was first coined by Geoffrey A. Moore in his book Crossing the Chasm: Marketing and Selling High-Tech Products to Mainstream Customers. This book created a new planning methodology in high-tech industries. This methodology provides tools and insights for moving cutting-edge products from early adopters into larger markets. “The Chasm” is the GAP within the technology adoption curve that any high tech product needs to traverse to become a scalable product. Before the Chasm the customers are risky consumers, people not afraid of trying new things,while after the chasm lays the mass markets, that need highly accepted and proven track technology to consume. The book helps Marketing department and teams understand the challenges required to take a new , innovative, high tech product into the mainstream markets. For this it emphasized the need to Marketing department to be in the consumer seat, making the product-market fit, and finding the most valuable product combinations to solve the consumers pains.
The Technology Adoption Life Cycle describes the evolution of any given market adoption of an innovation. Crossing the Chasm analyzes GAP’s that separates each stage, dividing this evolution in 4 steps.
- The Early Market (between early adopters and early majority), where buyers are early adopters. Ready to prove new technology.
- Crossing the Chasm (between early majority and late majority), pragmatists with a specific pain, with a problem not yet resolved but for substitutes.
- The eye of the Tornado (between late majority and laggards), where buyers are pragmatists following a leading group.
- The Main Stream (after laggards), where buyers are maintaining their investments in a now broadly adopted technology.
Impress your audience with our professional Crossing The Chasm Slides for PowerPoint and create presentations that appeal to executive audiences.
What’s inside this template
Example presentation scenarios
- A product manager can use the sales curve and CHASM marker to explain why early adopter traction does not automatically translate into mainstream market acceptance.
- A founder can use the cash flow valley of death band and investor categories to describe funding needs across technology creation, product development, and commercialization.
- A marketing leader can use the commercialization phase bands to align campaigns with the shift from early market messaging to mainstream buyer proof.
- An MBA instructor can use the adoption curve and public/private sector bar to teach the gap between invention, validation, and scalable market entry.
Features
- 100% editable presentation template
- Compatible with Microsoft PowerPoint and Google Slides
- 16:9 aspect ratio slides
- Scalable vector shapes, icons and illustrations
- AI-Ready for Microsoft Copilot and Claude
- Instant access and download
Frequently asked questions
Q: How should a presenter explain the crossing the chasm message with only two slides?
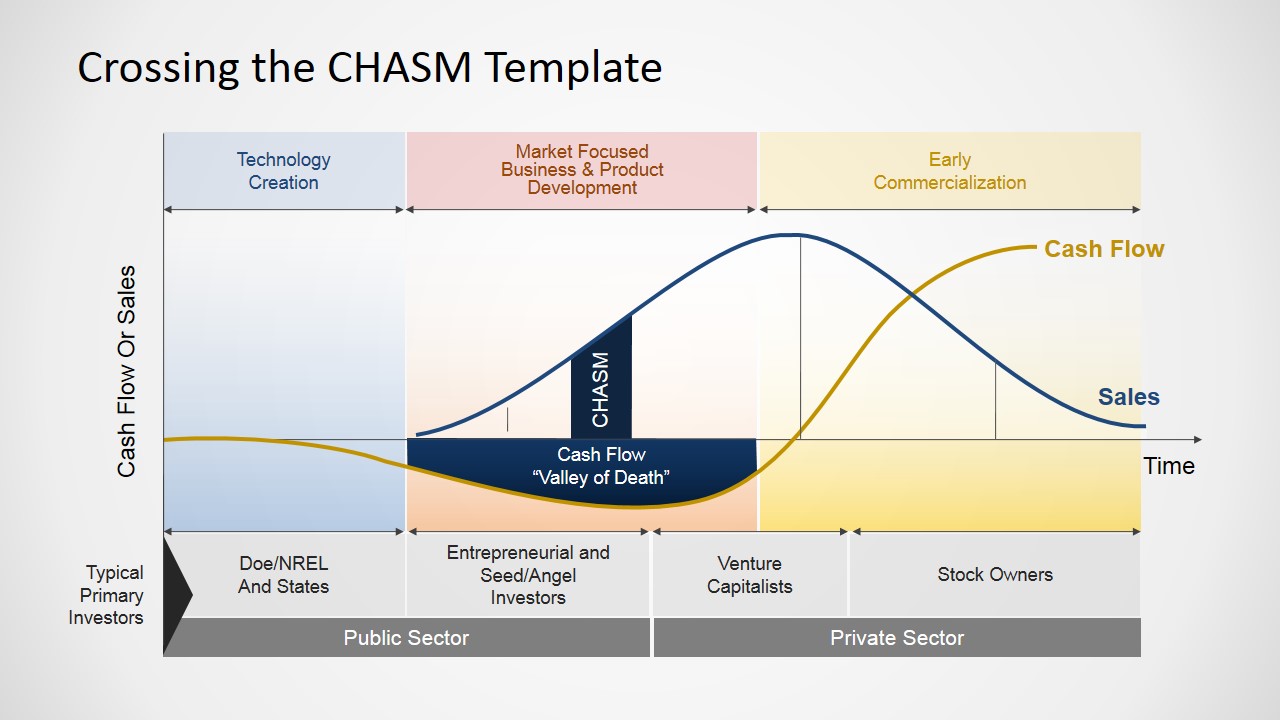
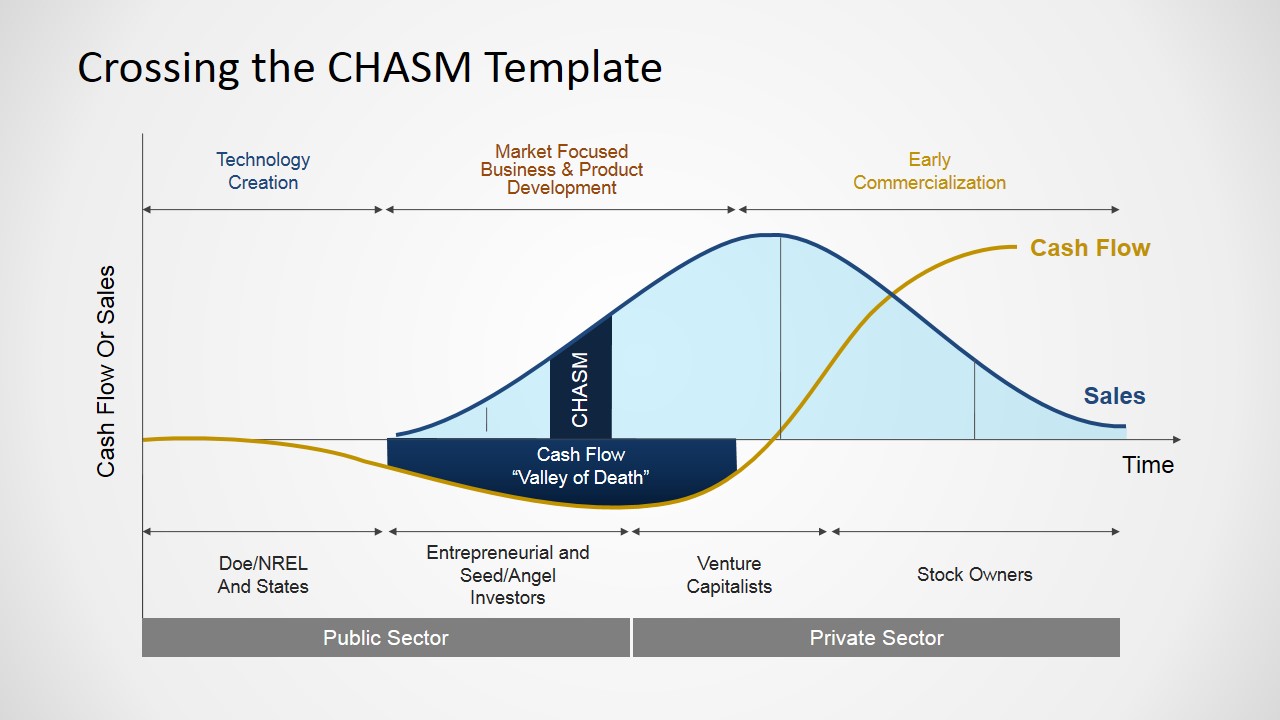
A: Start with the full diagram to establish the whole system: time, sales, cash flow, investor groups, and public versus private sector support. Then use the simplified diagram to focus attention on the CHASM and the valley of death. This sequence helps the audience see both the strategic context and the specific risk point.
Q: Who is this template best suited for in a business presentation?
A: This template fits presenters who need to explain why a high-tech product can succeed with early adopters yet still struggle to reach mainstream buyers. Product managers, founders, marketing teams, venture analysts, and instructors can use the adoption curve, funding bands, and cash flow line to connect market behavior with commercialization decisions.
Q: Why does the valley of death visual make the adoption concept easier to understand?
A: The diagram uses a physical gap and a dark valley shape to turn an abstract market adoption risk into a visible barrier. By placing the cash flow curve below the baseline while sales adoption rises later, the slide shows that product momentum and financial strain can happen at different times.
You may also like:


Crossing The Chasm Slides for PowerPoint
2-slide diagram template for crossing the chasm, adoption curves, and cash flow stages
Crossing The Chasm Slides for PowerPoint is a 2-slide diagram template for explaining technology adoption and market transition. It shows a chasm gap, sales curve, cash flow curve, funding stages, and public to private sector bands for product, marketing, and venture discussions in Microsoft PowerPoint and Google Slides.
- Category
- Diagrams
- Rating

 Loading...
- Aspect ratio
- 16:9, 4:3
- Item ID
- 6552-01
- Colors
 Microsoft PowerPoint
 Microsoft Copilot
 Claude for PowerPoint
Other formats supported
Subscribe today and get immediate
access to download our PowerPoint templates.