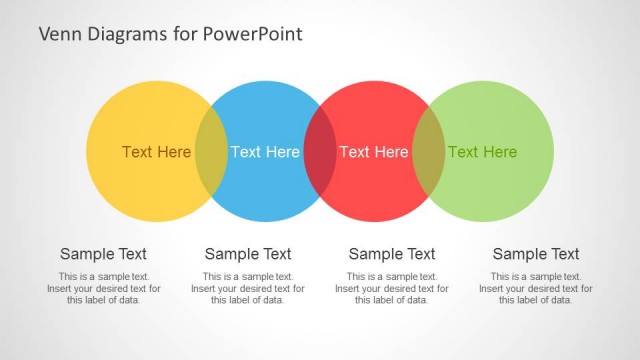
Slide 2 of 6 from Colorful Venn Diagrams for PowerPoint
Simple Venn Diagram Slide Design for PowerPoint
Venn Diagram with Three Circles for PowerPoint
- Diagram
- Venn
- Strategic Analysis Slide
- 16:9
- 100% Editable
The Venn Diagram with Three Circles slide from the Colorful Venn Diagrams for PowerPoint template offers a clear visual for comparing three concepts and illustrating set relationships. This slide layout, featuring editable shapes and vector icons, supports strategic analysis in business presentations and educational contexts, making it a useful addition to any slide deck requiring logical intersection explanations.
What’s on This Slide
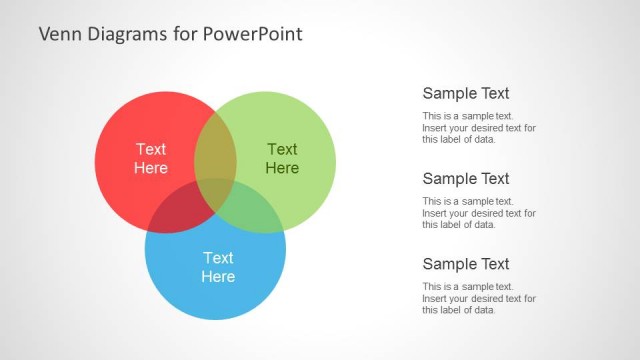
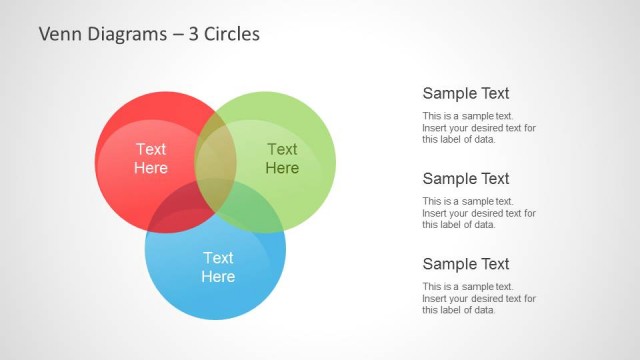
The slide features a three-circle Venn diagram arranged in a triangular layout. Each circle is a different color: red, blue, and green, with overlapping areas indicating intersections. Text placeholders are positioned within each circle, aligned centrally, and labeled as 'Text Here.' Additional text placeholders are located outside the circles, labeled 'Sample Text,' with left and right alignment. The background is a light gray, providing contrast to the colorful circles. The overall composition emphasizes the relationships between the sets represented by the circles.
How to Use It
This layout serves as a visual tool for illustrating relationships and intersections among three distinct sets. It is suitable for presentations in educational, analytical, or business contexts where comparisons or logical reasoning are required. This slide fits well after a problem-framing slide and can be used to clarify complex concepts or data relationships. It is effective for discussions on group dynamics, set theory, or any scenario requiring visual representation of overlapping data.
Text Placeholders & Capacity
Keep your copy within these limits so it fits without resizing. Node body slots can hold about 10 words each.
| Placeholder | Count | Max characters (approx.) |
|---|---|---|
| Item heading | 3 | 10 |
| Item body | 3 | 50 |
| Sample text | 3 | 50 |
Slide Keywords
Download unlimited PowerPoint templates, charts and graphics for your presentations with our annual plan.
DOWNLOADReturn to Colorful Venn Diagrams for PowerPoint.