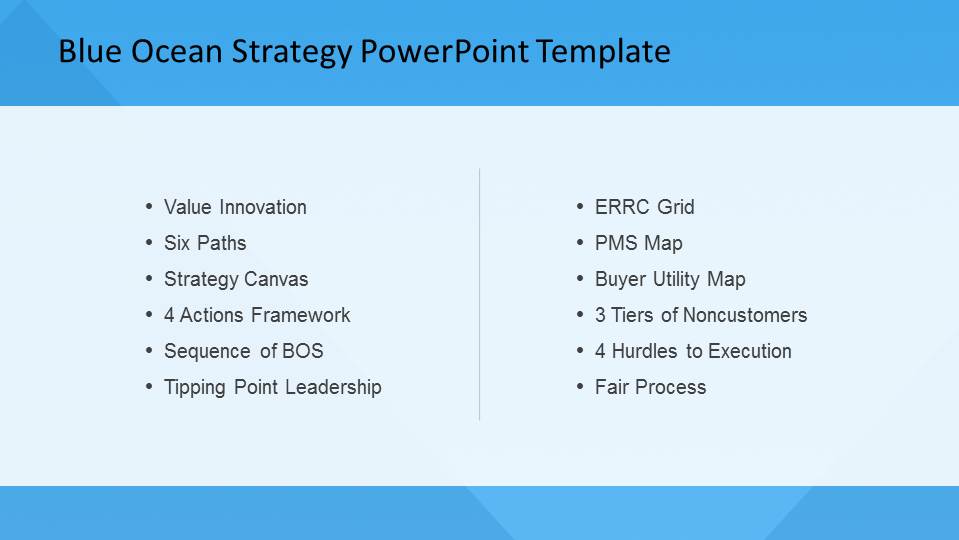
Blue Ocean Strategy PowerPoint Template is a professional and modern presentation for describing or explaining the Blue Ocean Strategy Theory. This Blue Ocean template for PowerPoint & Google Slides provides iconography and diagrams to work with the Blue Ocean Strategy Tools. Each Tool has a Slide for the description and application within the Strategy Analysis.
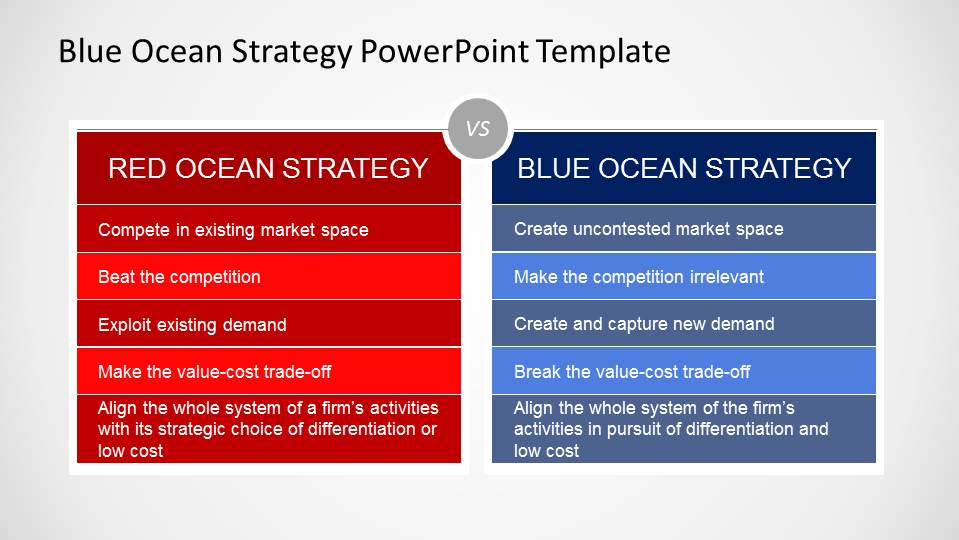
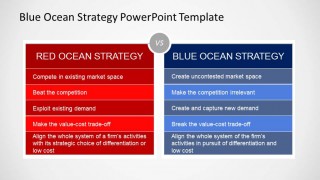
The born of Blue Ocean Strategy Model appeared with the publishing of the book of the same name, written by W. Chan Kim and Renée Mauborgne in 2005. The core idea of the Blue Ocean Strategy is to make the competition irrelevant and create new market space to exploit. The traditional competitive Markets are a hostile environment, where the metaphor of blood in the water (Read Ocean) represents them. Competitors fight to increase their market share with traditional competitive strategies and techniques like differentiation and low cost. On the other hand, the new markets where competition still does not exist (Blue Oceans) are where the company strategy needs to focus, where the market is fruitful. The first arrival fulfills customers’ demands. The exciting side of the story is that Blue Oceans (or fruitful markets) need to be discovered and generally require a disruption to appear.
The Blue Ocean Strategy Theory describes a set of Business Strategy tools that allows Companies to explore, create and exploit Blue Oceans and generate barriers to maintain them afterward. The Blue Ocean Strategy PowerPoint Template provides one slide per Tool, allowing the presenter to describe its analysis with a predefined shape that can be completed with the specific analysis information. This Template is ideal for presenting Blue Ocean Strategy analysis and conclusion, specific tools application, or just a business strategy lecture.
Each slide is crafted to not only represent the concepts visually but also to support presenters in explaining and applying these tools effectively.
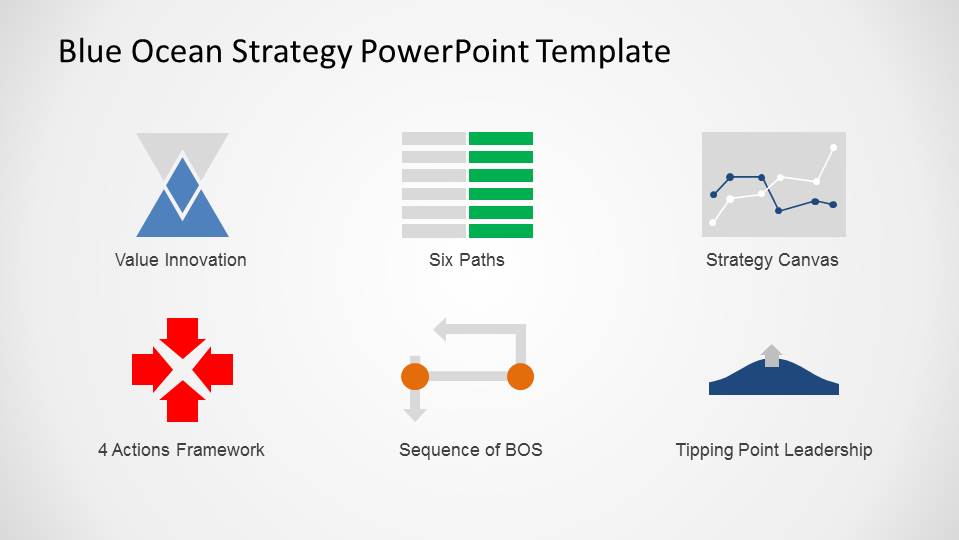
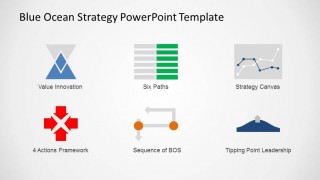
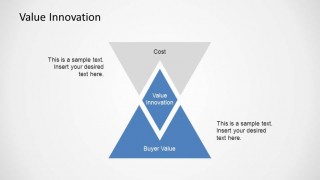
- Value Innovation Slide: This slide helps emphasize the concept of simultaneous pursuit of differentiation and low cost, which is at the heart of Blue Ocean Strategy. It’s an excellent tool to represent your organization’s unique value proposition.
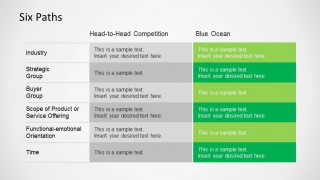
- Six Paths Framework Slide: It provides a practical approach to break away from competition and create a blue ocean by restructuring market boundaries.
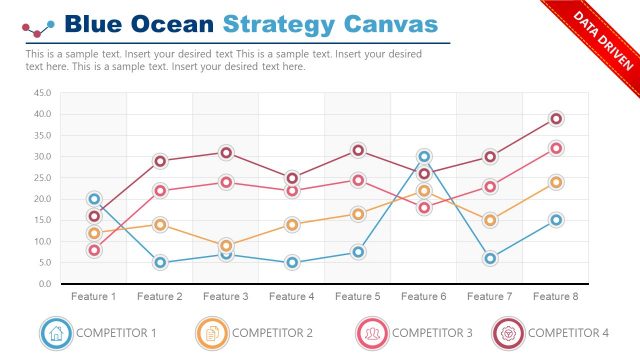
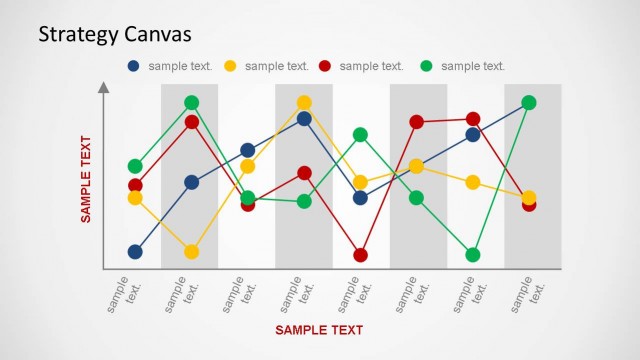
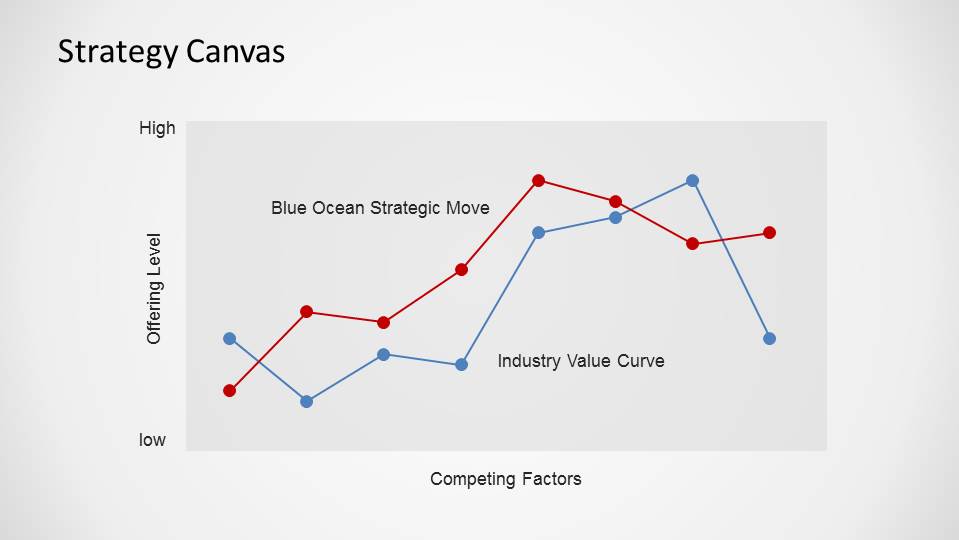
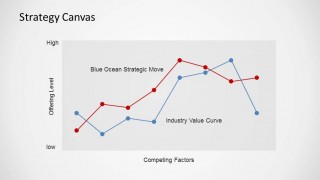
- Strategy Canvas Slide: It’s perfect for visually capturing the current strategic position of your company versus your competitors and guiding you towards creating a leap in value for your customers.
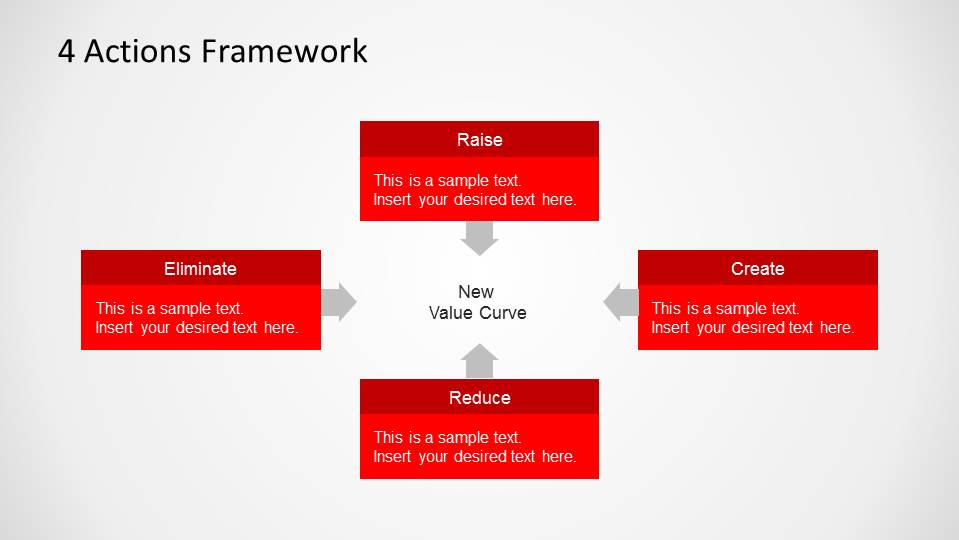
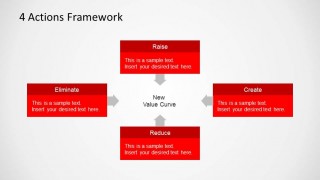
- 4 Actions Framework Slide: This slide helps in questioning the strategic logic and business model of your industry to create a new value curve.
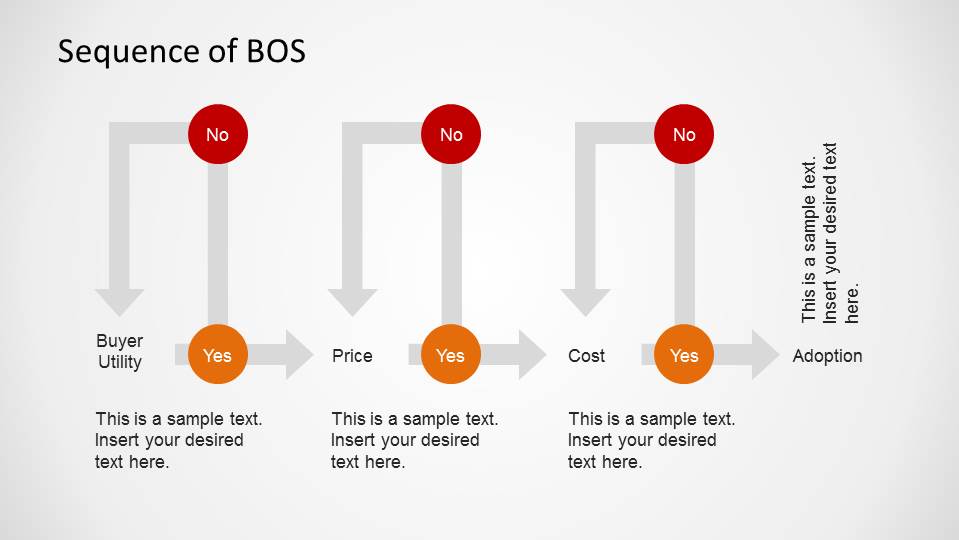
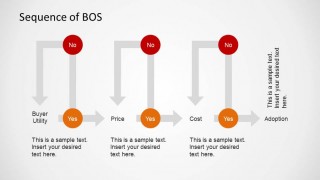
- Sequence of BOS Slide: It allows you to illustrate the right strategic sequence and check the commercial viability of your blue ocean idea.
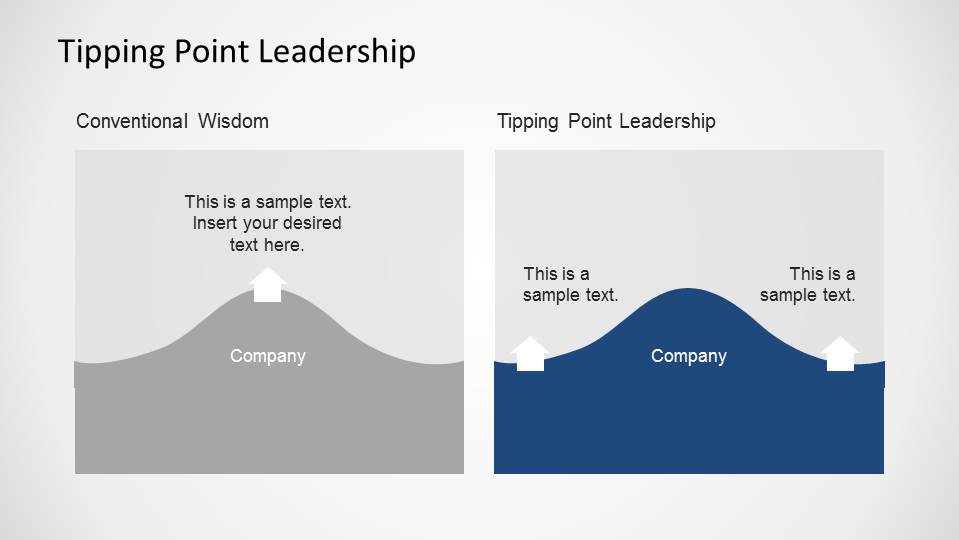
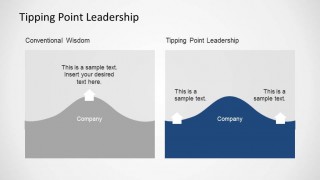
- Tipping Point Leadership Slide: Here you can outline how to overcome key organizational hurdles and mobilize the change, helping your organization tip towards the new strategy.
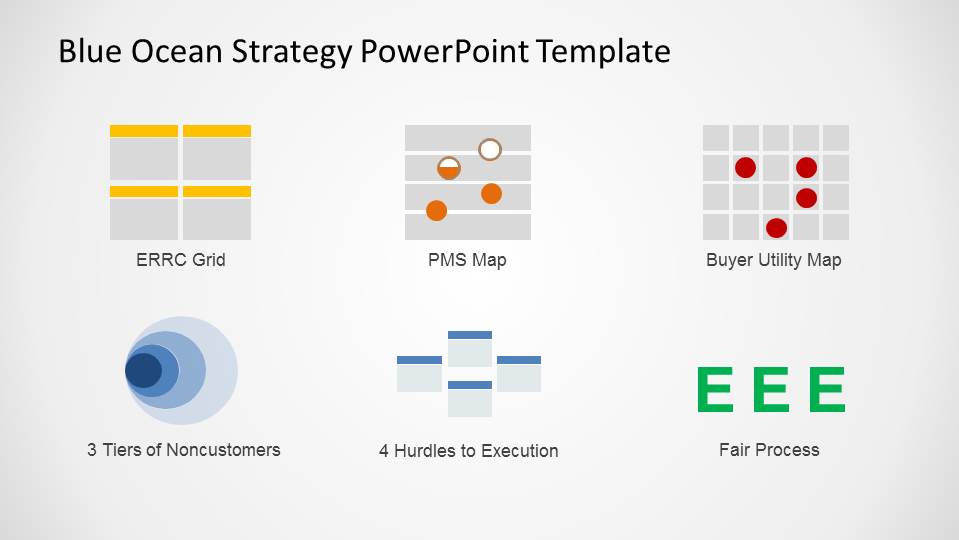
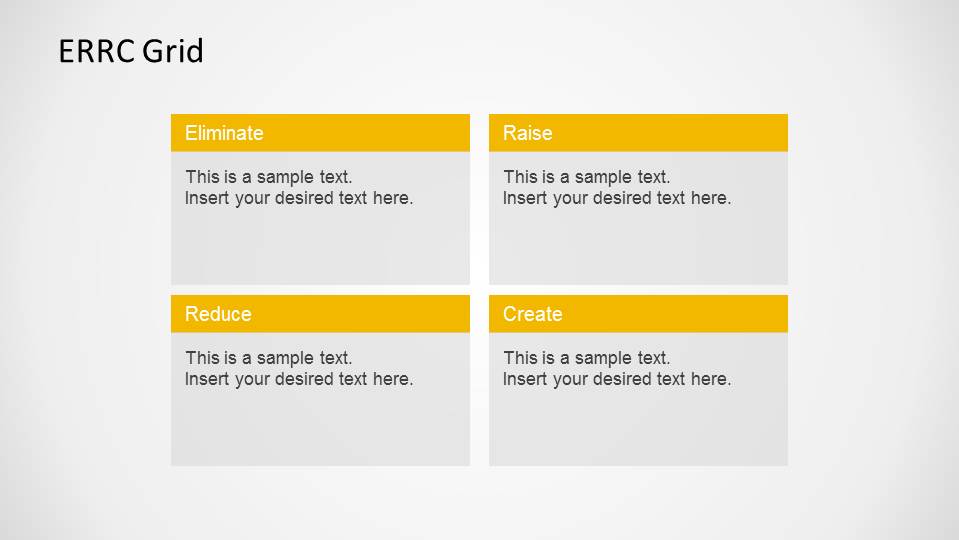
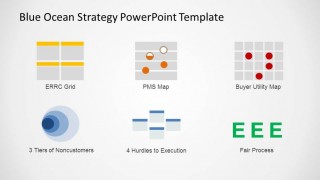
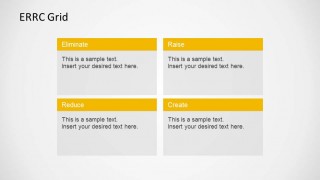
- ERRC Grid Model Slide: The ERRC slide template helps in defining what factors need to be eliminated, reduced, raised, and created in your industry to achieve a leap in value.
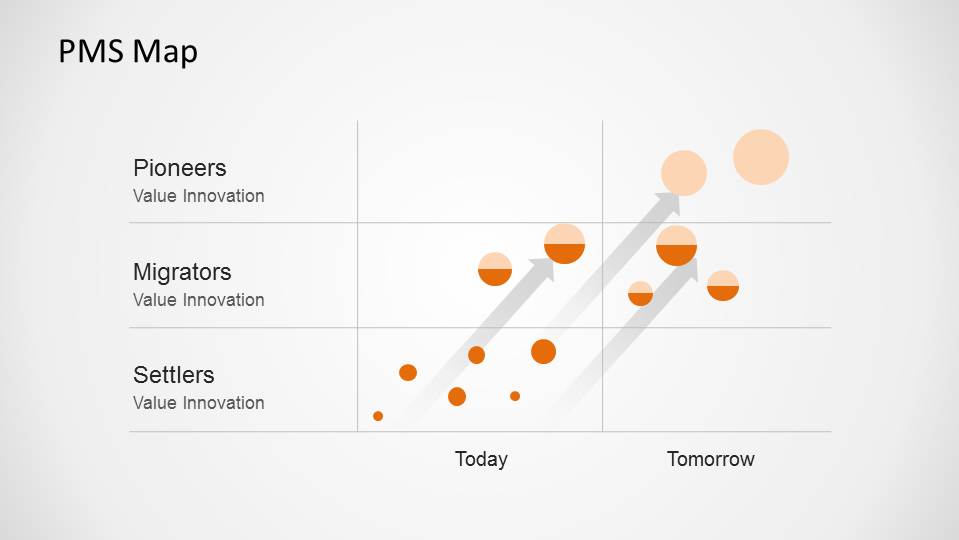
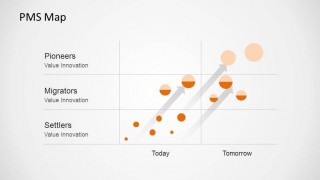
- PMS Map Slide: This Profit and Market Structure Map presentation slide enables you to visualize the market prospects and profit potential of your Blue Ocean Strategy.
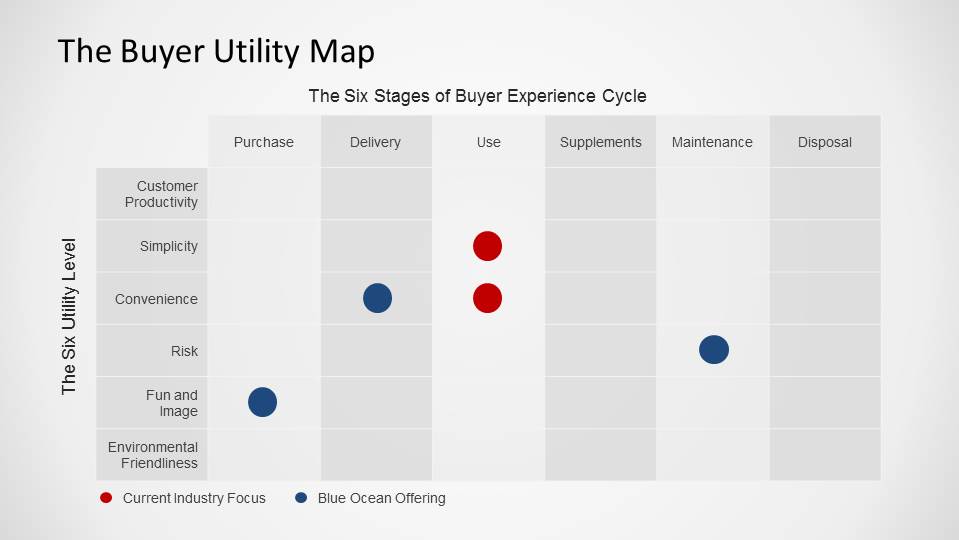
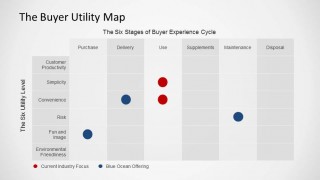
- Buyer Utility Map Slide: You can use this presentation slide to identify key utility levers and blocks in the buyer’s journey, ultimately leading to a blue ocean of uncontested market space.
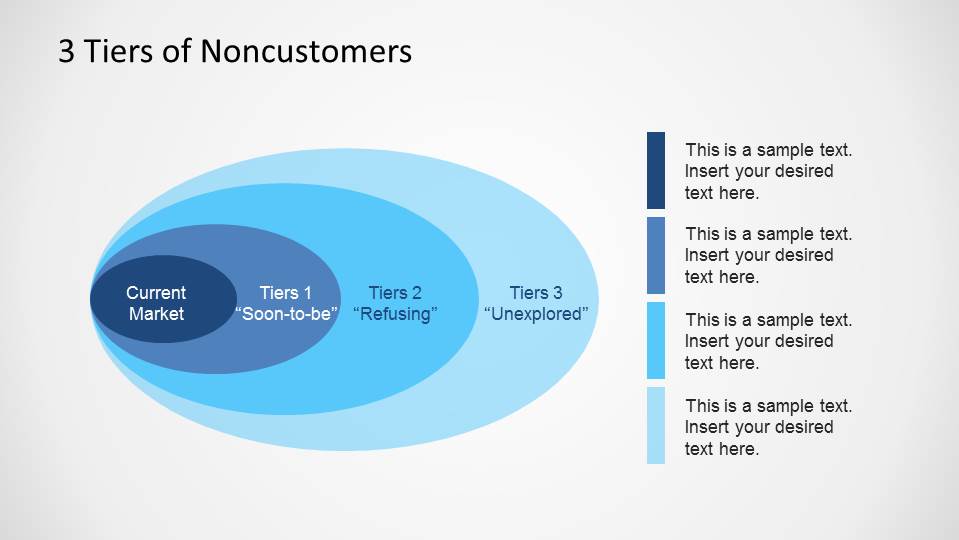
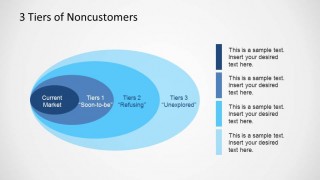
- 3 Tiers of Noncustomers Slide: This slide is useful to present the concept of converting noncustomers into customers, thereby unlocking a new demand.
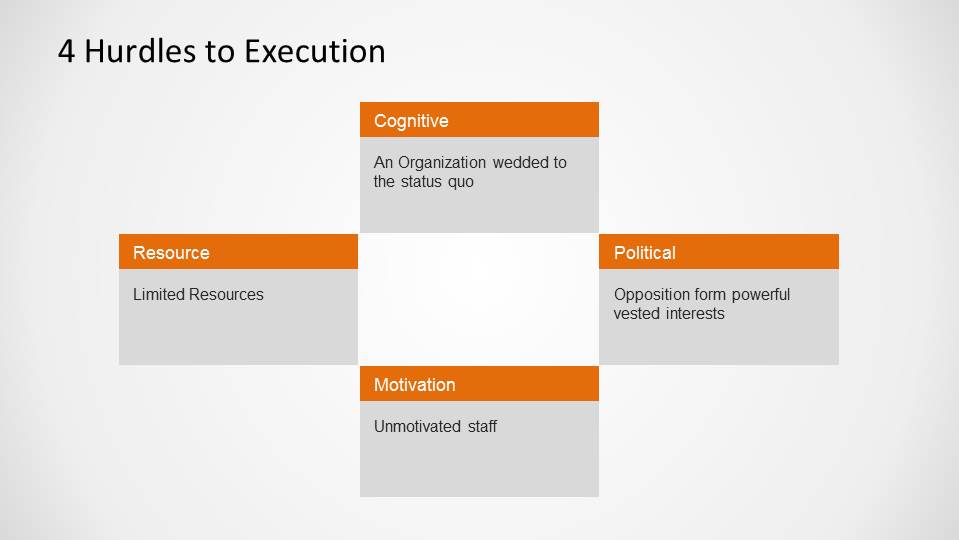
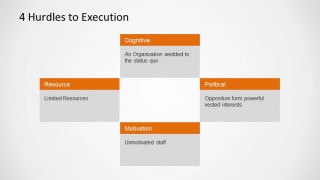
- 4 Hurdles to Execution Slide: This helps you address the key organizational hurdles when executing a Blue Ocean Strategy, including cognitive, resource, motivational, and political hurdles.
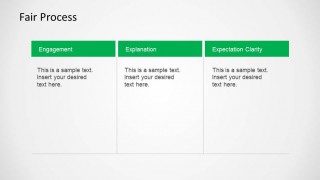
- Fair Process Slide: It enables you to illustrate how fair process management can influence employees’ attitudes and behaviors, thereby building execution into strategy.
The holistic set of blue ocean presentation slides in this PowerPoint template enables you to fully explore, create, and exploit Blue Oceans, building a compelling narrative around your company’s strategy. The Blue Ocean template objects and figures are 100% Editable, created with PowerPoint Shapes, allowing the user to fully customize each property (as size, color, position, gradient, and effects)
What’s inside this template
Example presentation scenarios
- A strategy consultant can use the red versus blue ocean comparison table and Strategy Canvas to brief executives on how a proposed move differs from current industry competition.
- An innovation leader can guide a workshop with the Six Paths matrix, 4 Actions Framework, and Buyer Utility Map to identify where new customer value may be created.
- A business professor or trainer can use the value innovation diagram, PMS Map, and 3 Tiers of Noncustomers slide to teach the core ideas behind market creation strategy.
- A corporate strategy team can use the sequence of BOS, 4 Hurdles to Execution, and Fair Process slides to connect opportunity analysis with internal adoption planning.
Features
- 100% editable presentation template
- Compatible with Microsoft PowerPoint and Google Slides
- 16:9 aspect ratio slides
- Scalable vector shapes, icons and illustrations
- AI-Ready for Microsoft Copilot and Claude
- Instant access and download
Frequently asked questions
Q: How should a presenter structure a Blue Ocean Strategy discussion with this deck?
A: Start with the red versus blue ocean comparison to set the strategic contrast, then move into the Value Innovation and Six Paths slides to explain how the opportunity is being reframed. Use the Strategy Canvas and ERRC Grid as the core analysis, and finish with execution slides so the discussion ends with decisions, not only concepts.
Q: Who is this template best suited for, and in what setting?
A: This template fits consultants, strategy teams, innovation leaders, and instructors who need to explain Blue Ocean Strategy in a structured business setting. It works best for workshops, executive briefings, or training sessions where the audience must compare the current market, assess buyer utility, classify noncustomers, and agree on execution hurdles.
Q: Why does the deck use red and blue comparison visuals across the frameworks?
A: The red and blue color metaphor helps the audience separate competitive-market behavior from market-creating strategy before the detailed tools appear. The comparison table, Strategy Canvas curves, and Buyer Utility Map reinforce that contrast visually, so presenters can move from the metaphor to concrete choices about value, cost, demand, and adoption.


Blue Ocean Strategy PowerPoint Template
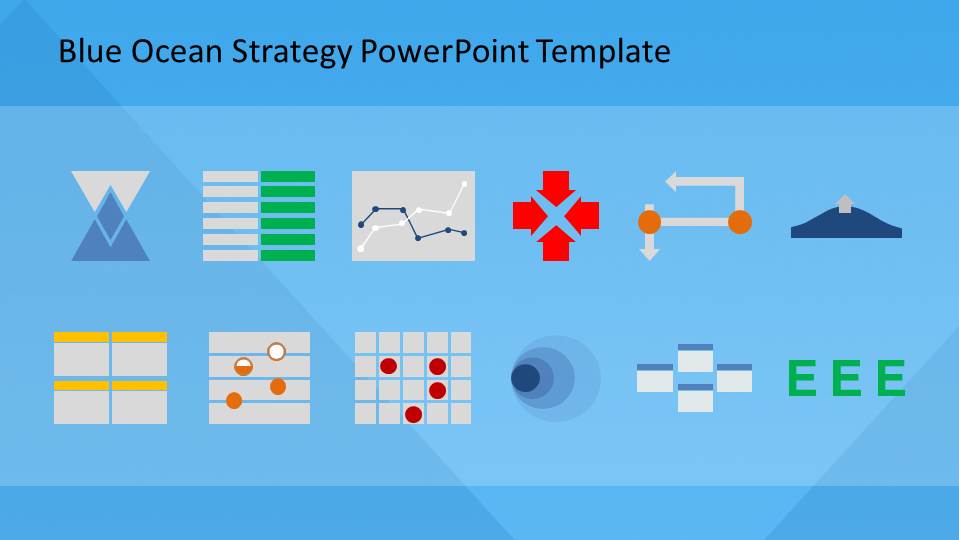
17-slide presentation template with Strategy Canvas, ERRC grid, and Blue Ocean planning diagrams
Blue Ocean Strategy PowerPoint Template is a 17-slide strategy presentation template for explaining and applying Blue Ocean tools. It includes a red versus blue ocean comparison table, Six Paths matrix, Strategy Canvas line chart, ERRC grid, PMS map, Buyer Utility Map, and execution hurdle slides for strategists, consultants, and leadership teams in PowerPoint and Google Slides.
- Category
- Strategy
- Rating


 Loading...
- Aspect ratio
- 16:9, 4:3
- Item ID
- 6539-02
- Colors
 Microsoft PowerPoint
  Microsoft Copilot
  Claude for PowerPoint
 Other formats supported
Subscribe today and get immediate
access to download our PowerPoint templates.