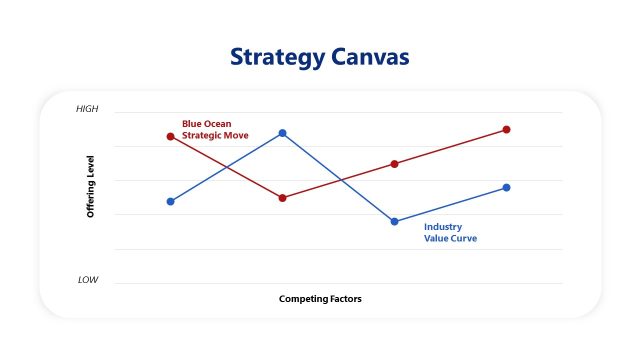
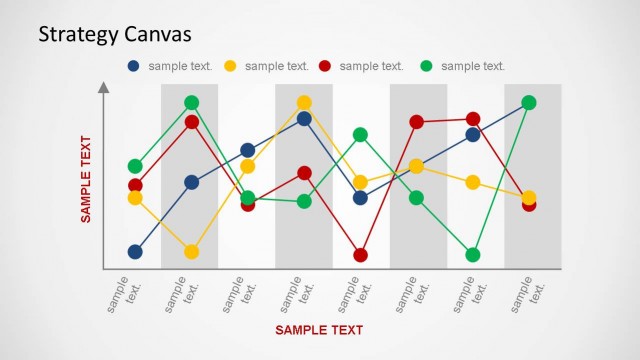
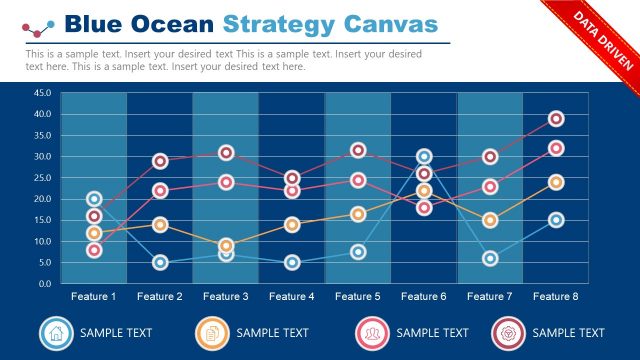
BOS Strategy Canvas PowerPoint Diagram
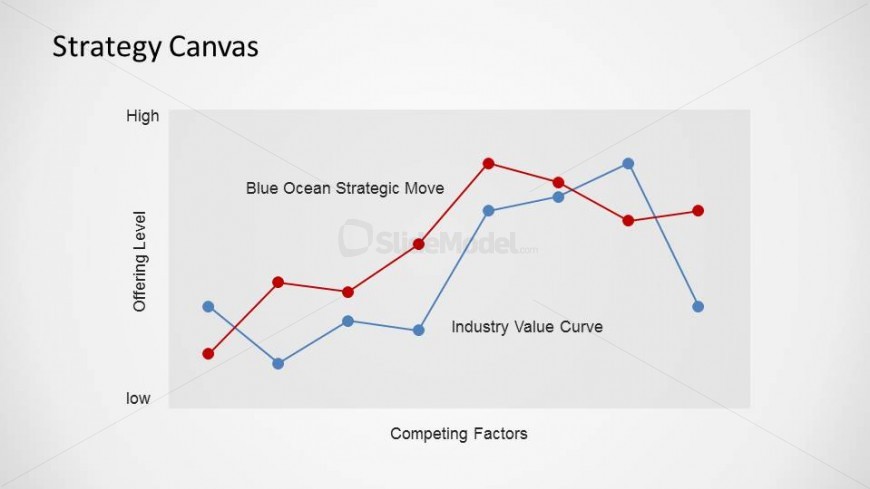
This slide contains a BOS Strategy Canvas PowerPoint Diagram. It is one of the most utilized tools from the model for its simplicity, practicality and visual impact. The PowerPoint slide contains a line graph with emphasized points. Line graphs are traditionally used to compare different sets of data over a period of time.
The PowerPoint template is most ideal for the analysis and diagnosis of an action framework. It captures the range of attribute which are important to the company and industry. The lines on the graph are colored in red and blue. These are found on a flat gray platform. The PowerPoint objects are 100% editable. They are made to be easily modified to suit the user’s needs.
Return to Blue Ocean Strategy PowerPoint Template.