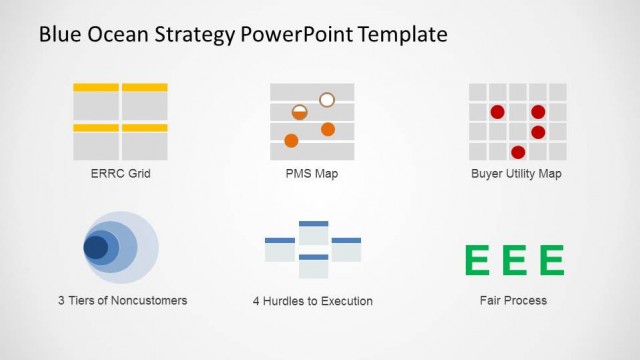
Blue Ocean Buyer Utility Map Tool
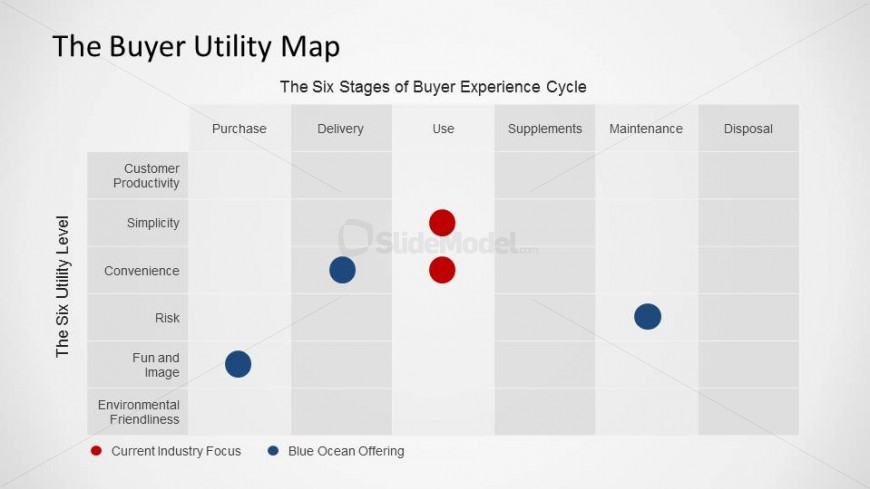
The PowerPoint slide features a blue ocean utility map tool, which may be used to show the interrelationship of the six stages of buyer experience and the six utility levels of the products and services offered by a specific company.
The slide design contains a table, which have the stages of buyer experience for column headers – namely, purchase, delivery, use, supplements, maintenance, and disposal – and the utility levels as row headers – labeled customer productivity, simplicity, convenience, risk, fun and image, and environmental friendliness. The respective stands of both the industry focus and the company’s offerings, are then plotted on the graph. The PowerPoint objects are 100% editable to fit the presenter’s needs and preferences.
Return to Blue Ocean Strategy PowerPoint Template.