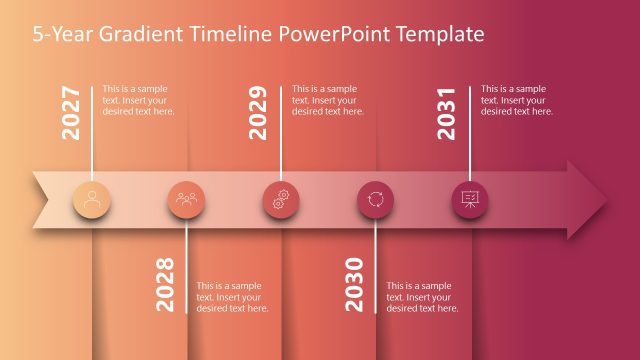
Animated 0 to 100 Gauge PowerPoint Template
Download our Animated 0 to 100 Gauge PowerPoint Template to showcase your employees’ performance in the stakeholder meetings. Professionals use a gauge diagram to visualize project performance, percentages, or related metrics where they need to measure something on a scale from zero to 100. For instance, a project manager can showcase the efficiency of their team in stakeholder meetings using this animated gauge diagram. We have designed this simple and powerful gauge meter diagram to enable users to communicate their ideas in a visually appealing format. Further, our template is fully compatible with other versions of Microsoft PowerPoint. You can change the colors, shapes, or type of animations used in the template to fit their needs accurately.
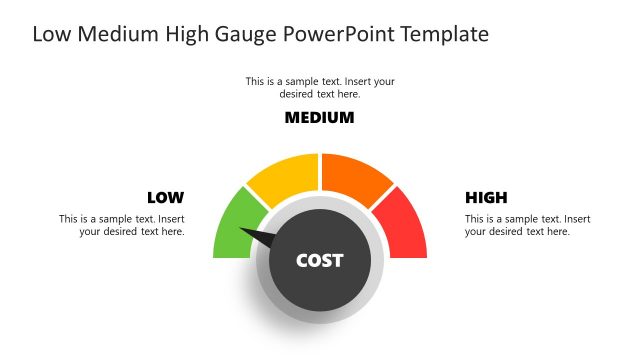
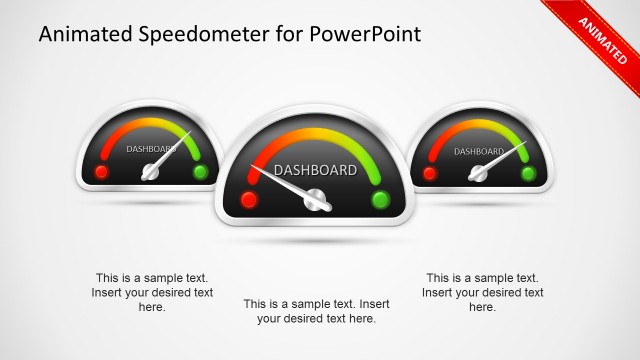
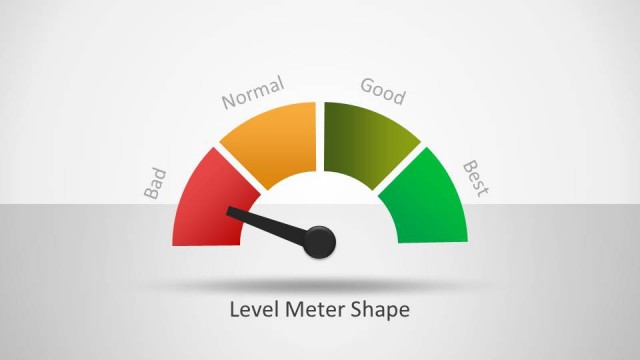
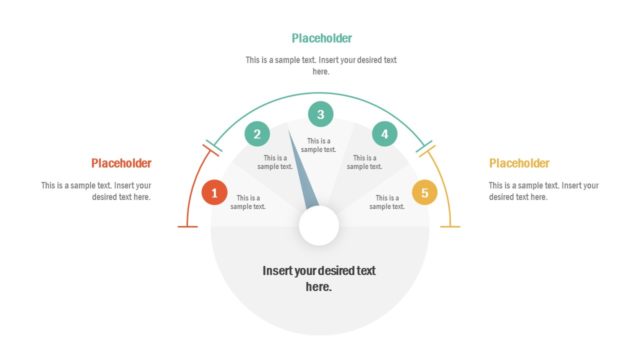
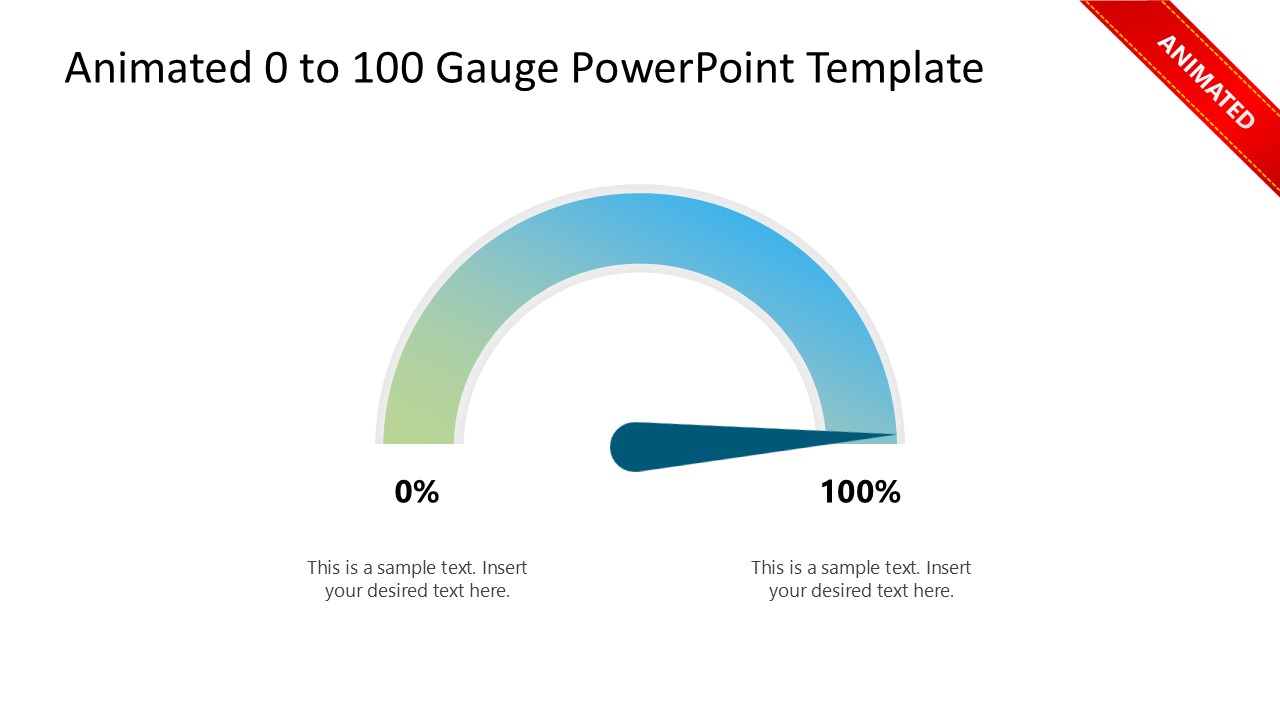
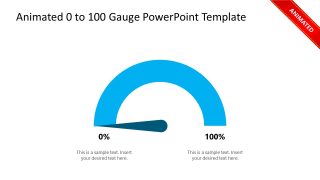
The Animated 0 to 100 Gauge PowerPoint Template features a speedometer diagram that displays a semicircular shape with a needle at its center. The point of the needle indicates the level of the performance or whatever else is being gauged. The speedometer diagram has a thick bar. The first slide shows a gradient color in the bar, the second has a grey color, while the third one has a blue color. When the needle in the needle movie moves along the semicircular path, the animated effect displays a blue color in the outline. When it is near 100, the bar starts showing a green gradient indicating a positive signal.
At the bottom of the zero-level and 100-level, there is a placeholder text line to display the information relevant to the business discussion. You can change the template colors, shapes, or other terms used in the template to match your theme. Download the animated gauge diagram template and personalize it for your business meetups!


You must be logged in to download this file.
DOWNLOAD- Category
- Diagrams
- Rating

 Loading...
- Size
- 16x9
- Item ID
- 23278-01
- Colors
Subscribe today and get immediate
access to download our PowerPoint templates.