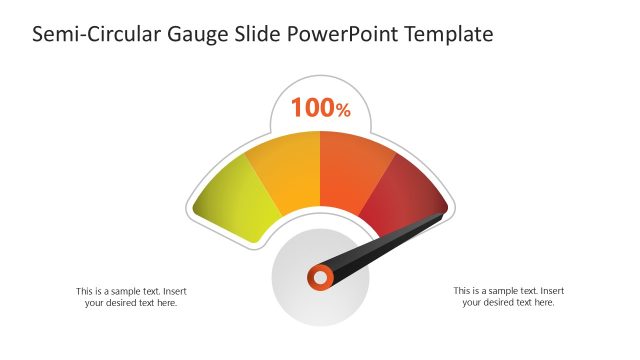
Animated Dashboard Speedometer Template for PowerPoint is a presentation design element that you can use to make awesome dashboard slides in Microsoft PowerPoint.
This template for PowerPoint & Google Slides comes with animated speedometers and gauge infographics. You can also adjust speedometer dials in various slides to change the speed on the given meters, so that you can reflect upon a specific point of view to effectively present it to your audience. You can use this gauge PPT template with animations in your own dashboards, or download dashboard PPT templates and combine them in one of the components.
The speedometers can be used for a variety of topics and slide layouts such as comparison slides, timelines or diagrams with a touch of your own creativity.
What’s inside this template
Example presentation scenarios
- An operations manager can brief executives on performance health by using the three-gauge dashboard layout to separate cost, quality, and delivery status.
- A customer experience lead can present Net Promoter Score movement by using the red-to-green gauge ranges and editable needles to show satisfaction levels at a glance.
- A project manager can compare workstream readiness by using the three-column comparison card slide with one speedometer and text area for each team.
- A sales leader can summarize pipeline momentum by using the analog MPH dashboard slide as a central metric visual with supporting side gauges for secondary indicators.
Features
- 100% editable presentation template
- Compatible with Microsoft PowerPoint and Google Slides
- 16:9 aspect ratio slides
- Scalable vector shapes, icons and illustrations
- Ready with Animations & Transitions in PowerPoint
- AI-Ready for Microsoft Copilot and Claude
- Instant access and download
Frequently asked questions
Q: How should a presenter use the gauges without making the message feel decorative?
A: Treat each gauge as a judgment about one metric, not as a generic graphic. Define what the red, yellow, and green zones mean before showing the reading, then use the nearby text placeholder to state the business implication. This keeps the audience focused on status, cause, and next action rather than the dial artwork.
Q: What kind of presentation is this template best suited for?
A: This template fits short status briefings where leaders need to read performance quickly. It works well for KPI health, Net Promoter Score, risk level, readiness, or service quality updates. The three-column card slide is useful when the presenter must compare teams, regions, products, or workstreams with the same visual scale.
Q: Why does the speedometer metaphor work for dashboards and KPI updates?
A: A speedometer turns an abstract score into a familiar sense of low, caution, and high. The red-to-green arc creates instant orientation, while the needle creates a clear point of attention. The central analog dial on Slide 5 is especially effective when one headline metric should dominate the discussion.


Animated Dashboard Speedometer Template for PowerPoint
5-slide animated presentation template with speedometer gauges, dashboard dials, and comparison cards
Animated Dashboard Speedometer Template for PowerPoint is a 5-slide presentation template for showing performance status with gauge visuals. It includes three-gauge dashboard layouts, comparison cards, a spotlight panel, and an analog speedometer dashboard. It is intended for KPI updates, satisfaction scores, risk levels, and status reporting in Microsoft PowerPoint and Google Slides.
- Category
- Shapes
- Rating


 Loading...
- Aspect ratio
- 16:9
- Item ID
- 8115-01
- Colors
 Microsoft PowerPoint
 Microsoft Copilot
 Claude for PowerPoint
Other formats supported
Subscribe today and get immediate
access to download our PowerPoint templates.