8Vs of Big Data PowerPoint Template
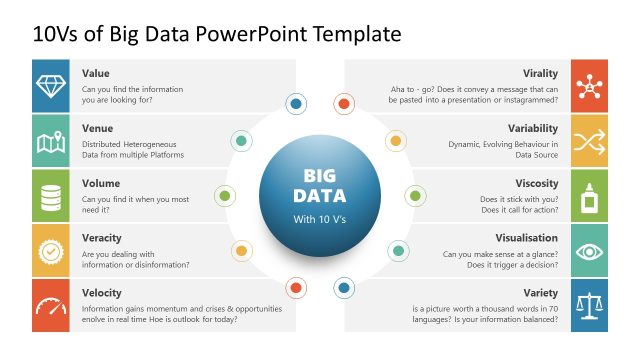
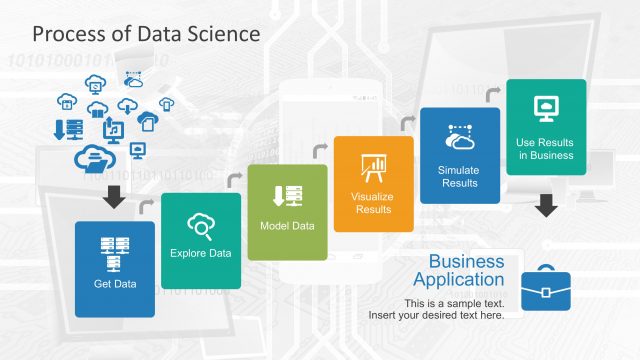
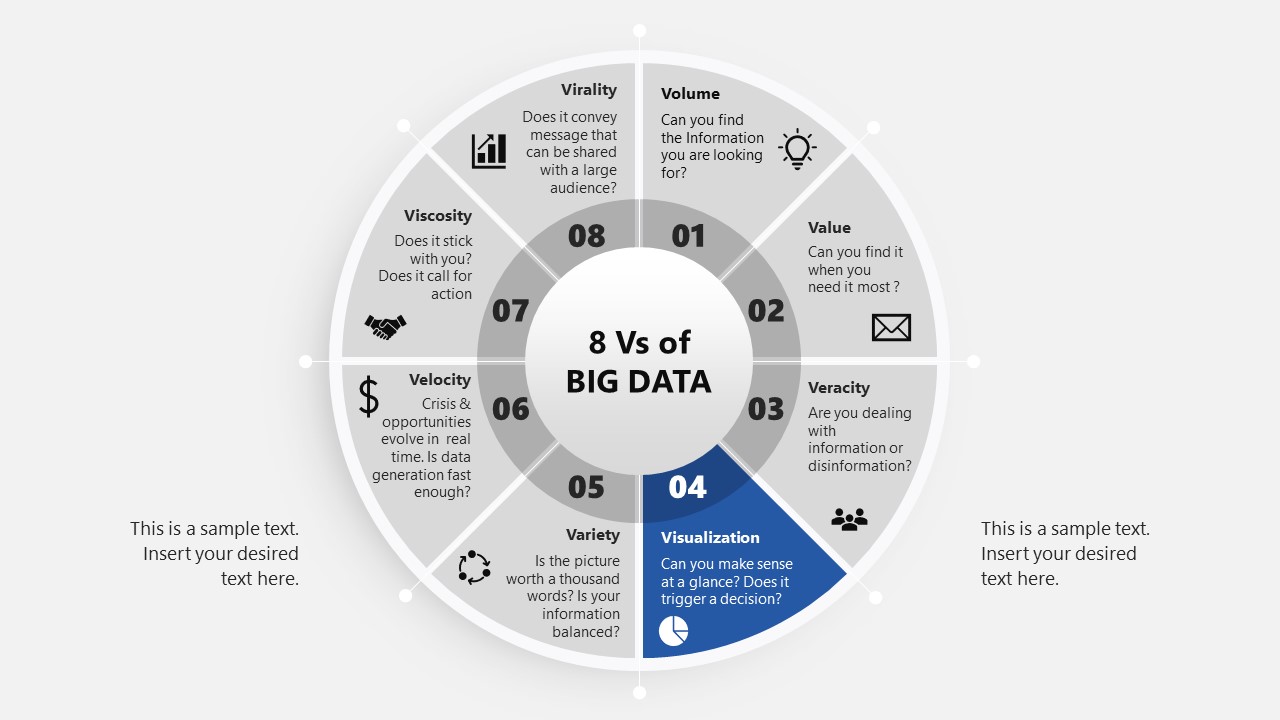
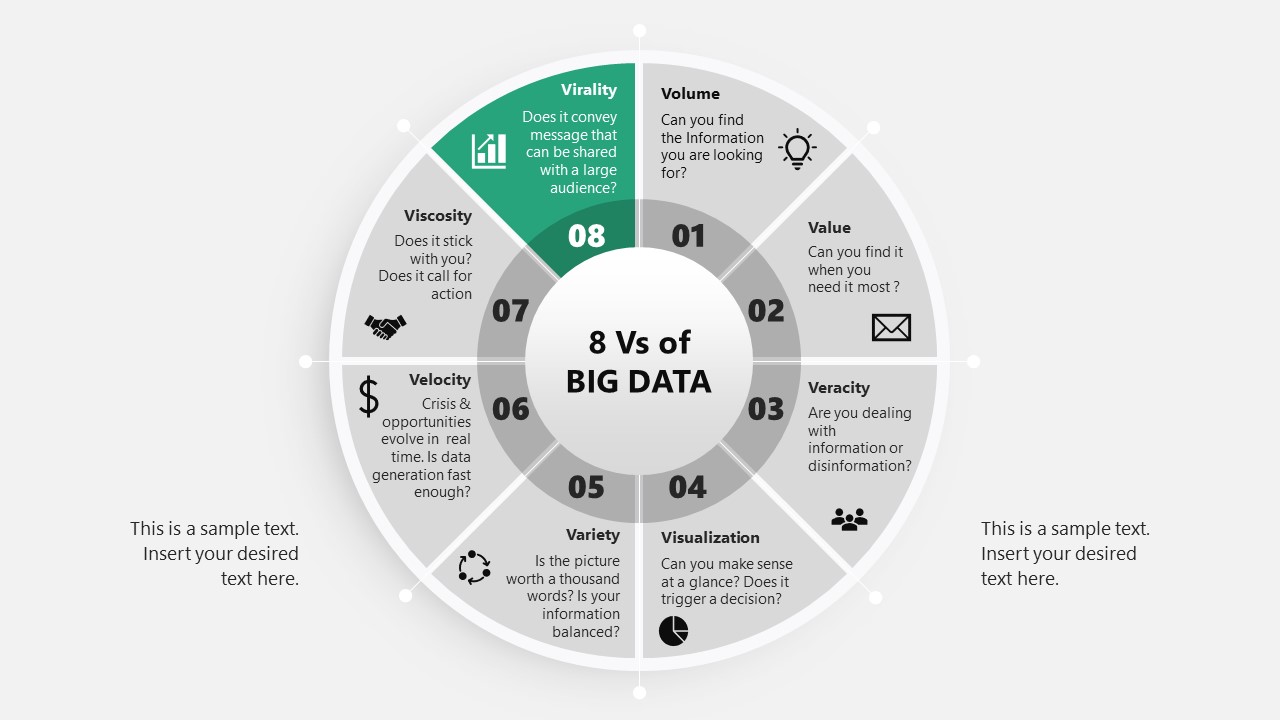
Utilize our 8Vs of Big Data PowerPoint Template to convey the complex concepts related to big data in a simplified format. Big data refers to large data sets that are too large or complex that they cannot be dealt with with traditional data processing measures. Big data originate from various resources and grows exponentially with time. Big data enables businesses to collect data from social media, web visits, call logs, and other digital platforms. Organizations can use big data to tailor their marketing strategies to enhance the user experience, engagement, and conversion rates. Cloud computing professionals can also leverage this data warehousing template to showcase the attributes of big data necessary for cloud operations. We have crafted this big data template for professionals to make training or educational presentations for seminars and workshops. Using artificial intelligence PowerPoint slides, developers can emphasize the significance of data quality at the enterprise level. Professionals can demonstrate the following eight Vs in the big data template:
- Volume
- Value
- Veracity
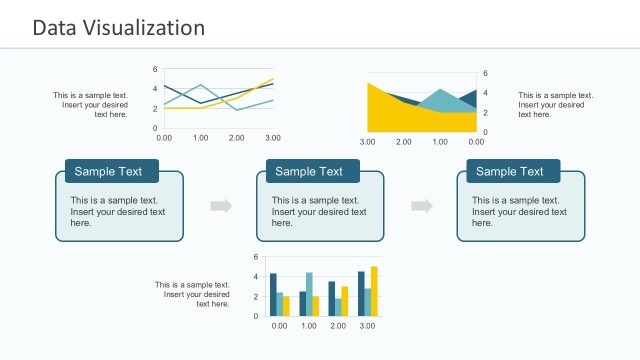
- Visualization
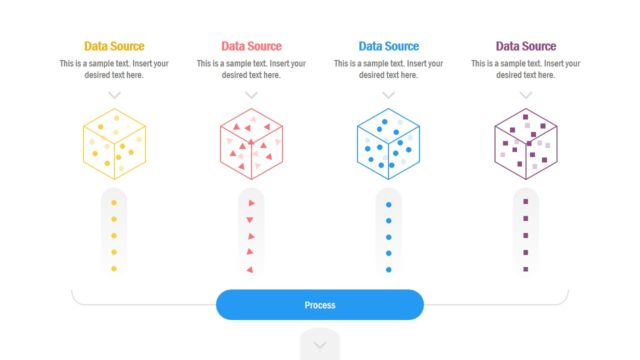
- Variety
- Velocity
- Viscosity
- Virality
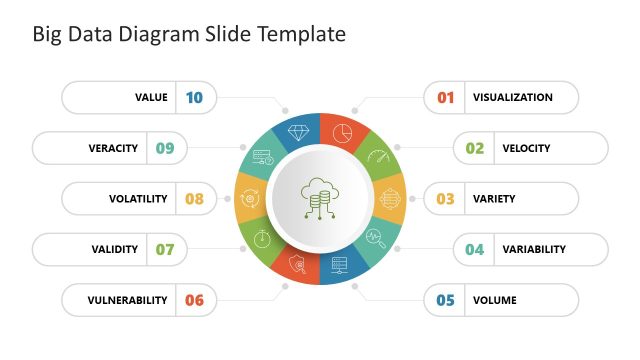
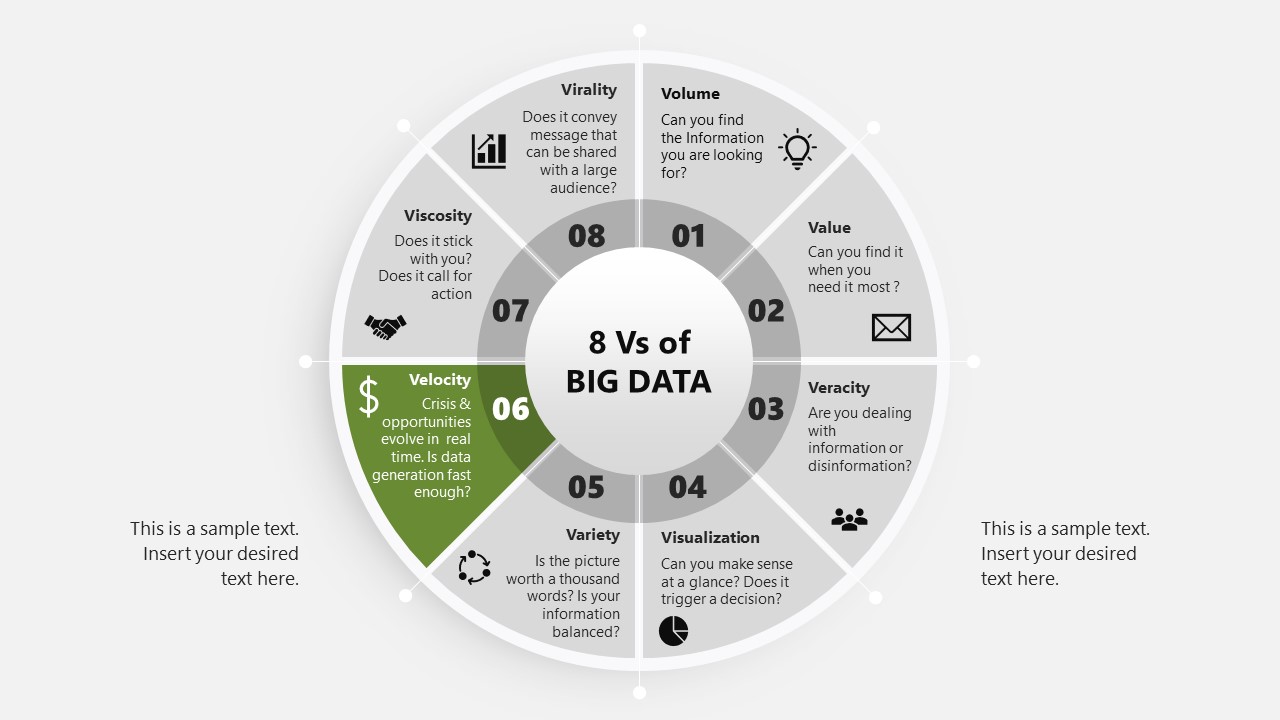
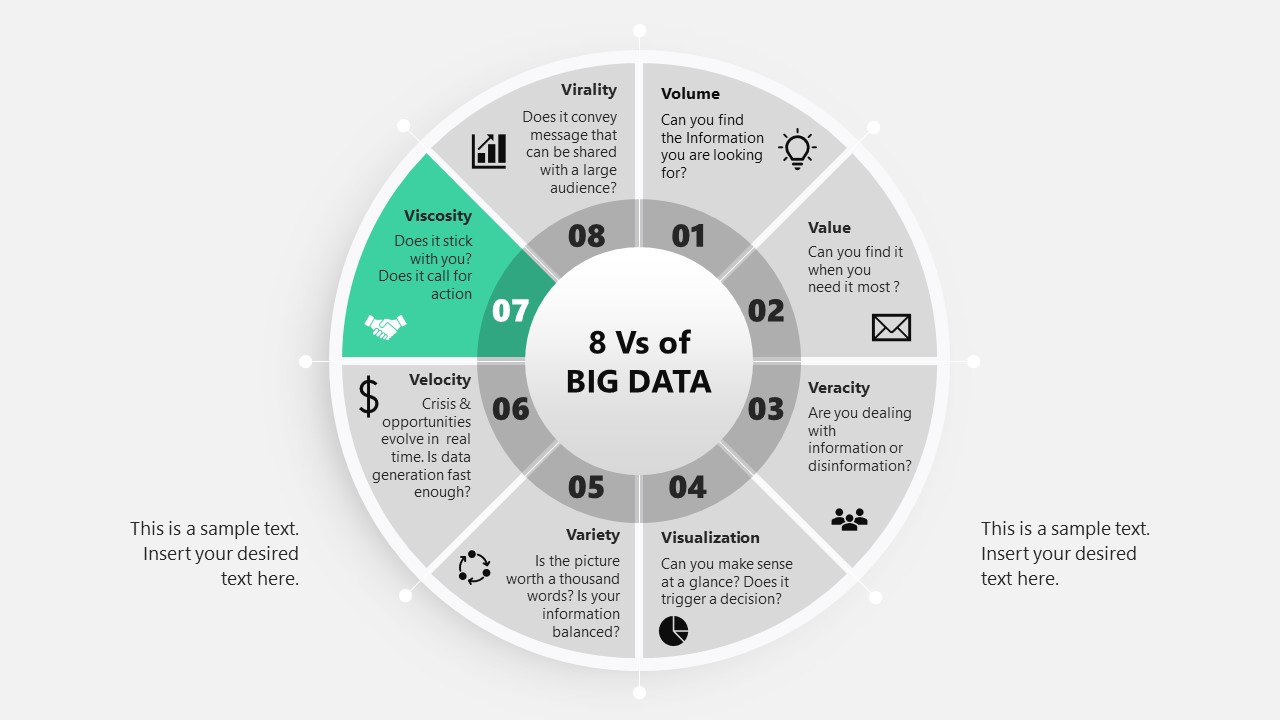
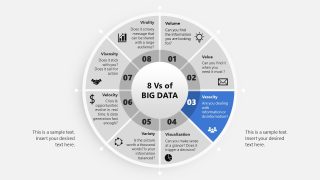
The template’s title slide consists of a large circular diagram similar to a spin wheel. The circular shape is divided into eight segments, one for showing each V of the big data. In the center, a title text is written in a small circular section. The first four segments have blue shading, while the next four have a green color scheme. Each segment has four elements: a title text, the number of the particular segment, placeholder text where users can display the relevant details, and a graphical icon. Using infographic icons enhances the visual impact of the template and engages the audience.
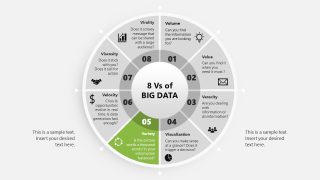
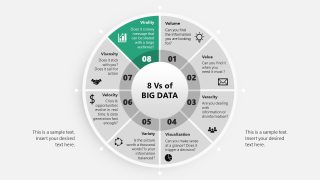
Moreover, each point is individually discussed in the following slides using a spotlight effect, i.e., color highlighting the point under discussion while greying the other sections. This effect can help professionals discuss important topics thoroughly in a well-descriptive manner. Furthermore, users can also write necessary details in two editable text boxes provided around the circular diagram on each slide.
Presenters can change the colors, shapes, and PowerPoint icons according to their theme and choices. They can also repurpose the template based on their needs. So, personalize our 8Vs of Big Data PowerPoint Template and make effective business presentations for your executive sessions today!


You must be logged in to download this file.
DOWNLOAD- Category
- Diagrams
- Rating

 Loading...
- Size
- 16x9
- Item ID
- 22120-01
- Colors
Subscribe today and get immediate
access to download our PowerPoint templates.