Slide 4 of 9 from 8Vs of Big Data PowerPoint Template
Veracity Slide – 8Vs of Big Data Template
8 Vs of Big Data Diagram Slide
- Diagram
- Segmented Wheel
- Concept Explanation Slide
- 16:9
- 100% Editable
What’s on This Slide
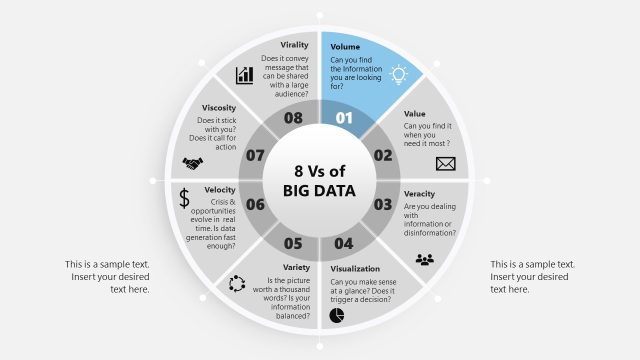
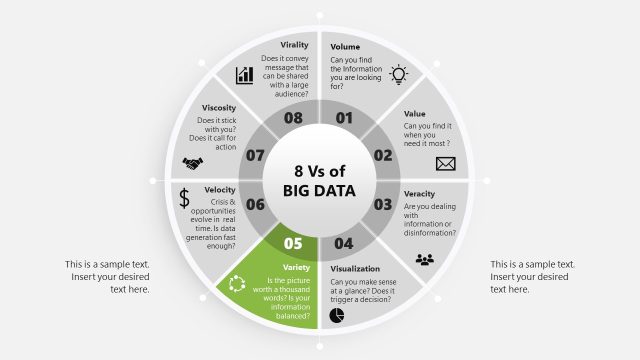
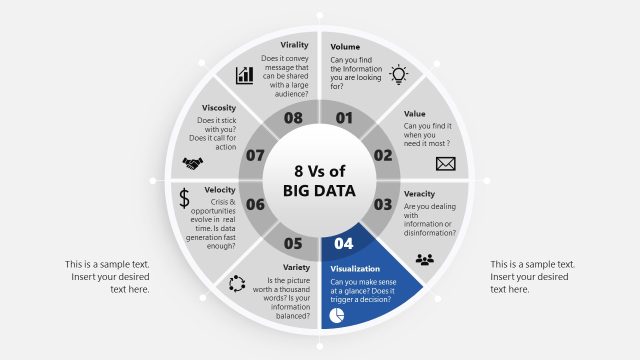
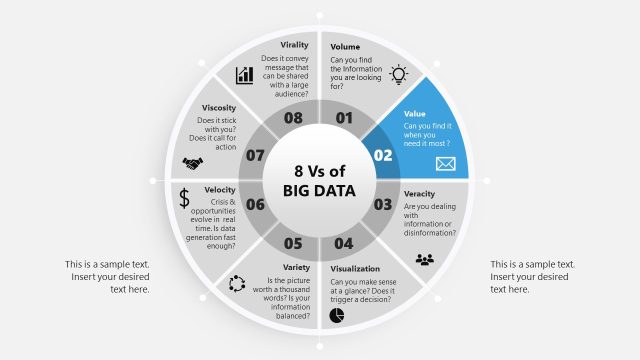
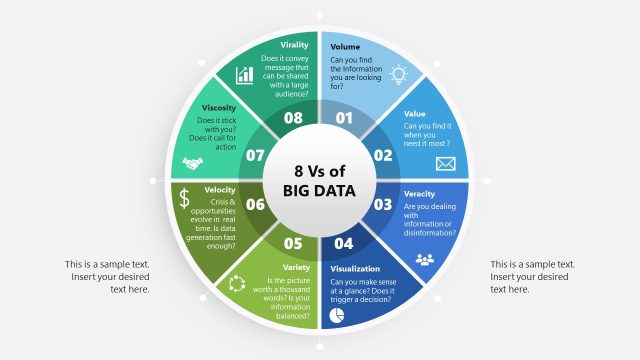
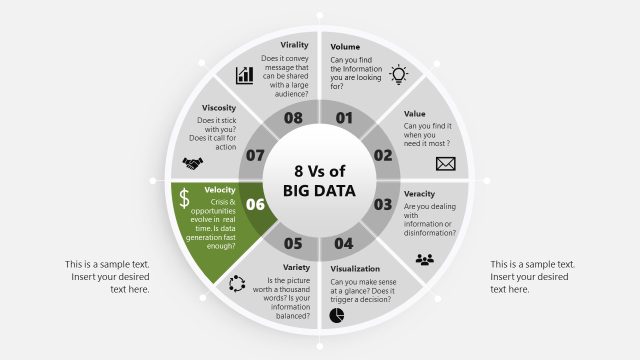
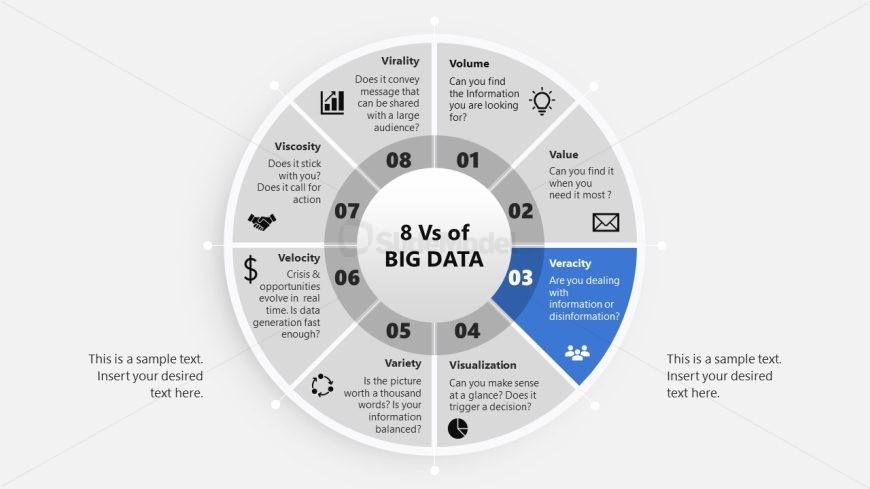
The layout features a circular diagram divided into eight segments, each representing a 'V' of Big Data. The segments are labeled with terms such as 'Veracity', 'Velocity', and 'Value', positioned around a central circle that states '8 Vs of BIG DATA'. Each segment contains a question related to its respective term, with visual icons accompanying some segments. Text placeholders are located at the bottom and within each segment for additional information. The overall color scheme includes blue, gray, and white, with a clean, organized appearance.
How to Use It
This layout serves as a visual representation of the 8 Vs of Big Data, making it suitable for discussions on data characteristics in a business context. It can be used in presentations to explain data analysis strategies or to highlight the importance of each 'V' in decision-making processes. The circular format allows for easy comparison and understanding of the concepts. This slide fits well after introductory content on Big Data, providing a structured overview before delving into detailed discussions on each aspect.
Text Placeholders & Capacity
Keep your copy within these limits so it fits without resizing. Node body slots can accommodate roughly 15-20 words each.
| Placeholder | Count | Max characters (approx.) |
|---|---|---|
| Item heading | 8 | 30 |
| Item body | 8 | 100 |
| Slide title | 1 | 30 |
| Body paragraph | 3 | 100 |
Slide Keywords
Download unlimited PowerPoint templates, charts and graphics for your presentations with our annual plan.
DOWNLOADReturn to 8Vs of Big Data PowerPoint Template.