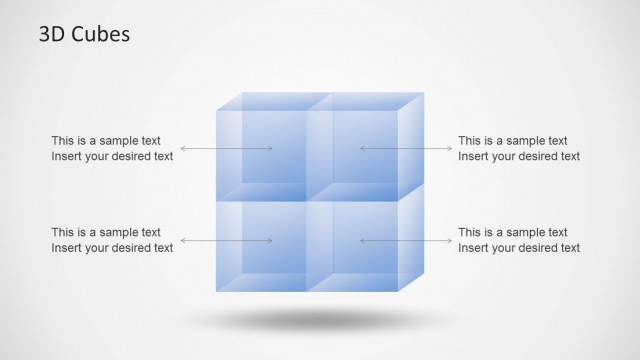
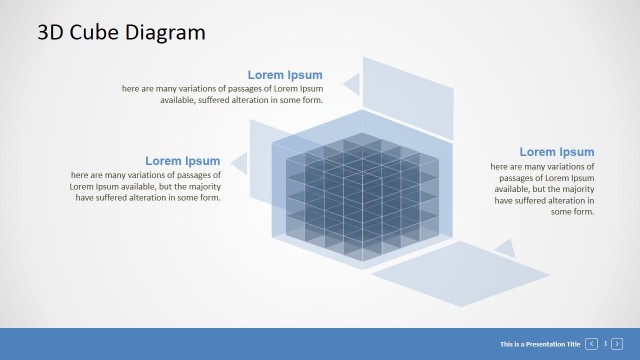
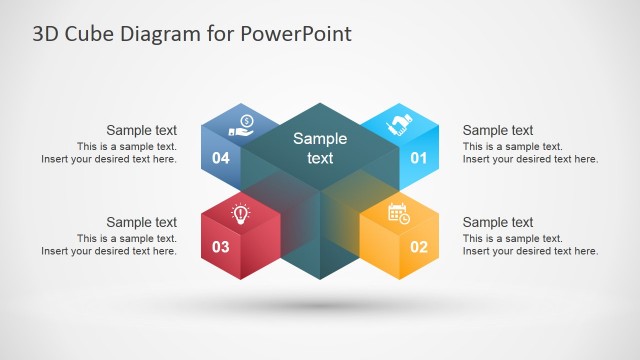
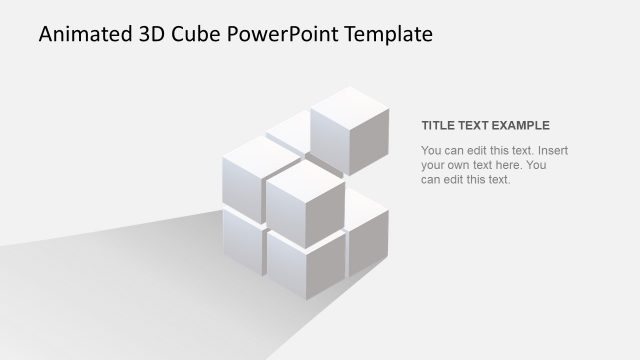
3D Big Data Concept Cubes for PowerPoint is a nice representation of a data warehouse cube that you can use for big data presentations.
The diverse big data themed cube slides are easy to customize and can help you elaborate upon complex big data topics with the aid of 3D slides.
What’s inside this template
Example presentation scenarios
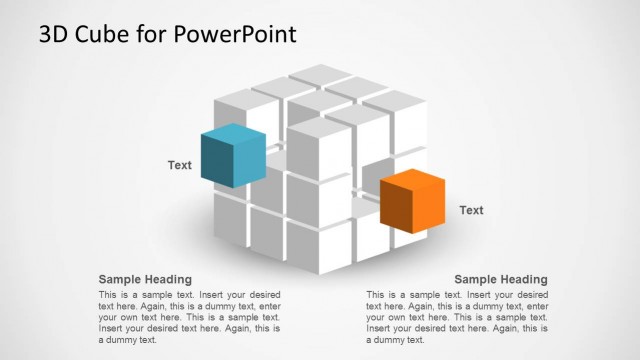
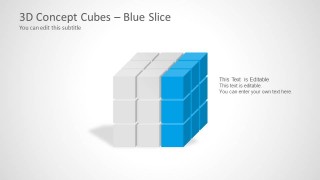
- A data architect can introduce a warehouse model by using the full cube cover and colored slice diagrams to show how layers or subject areas fit together.
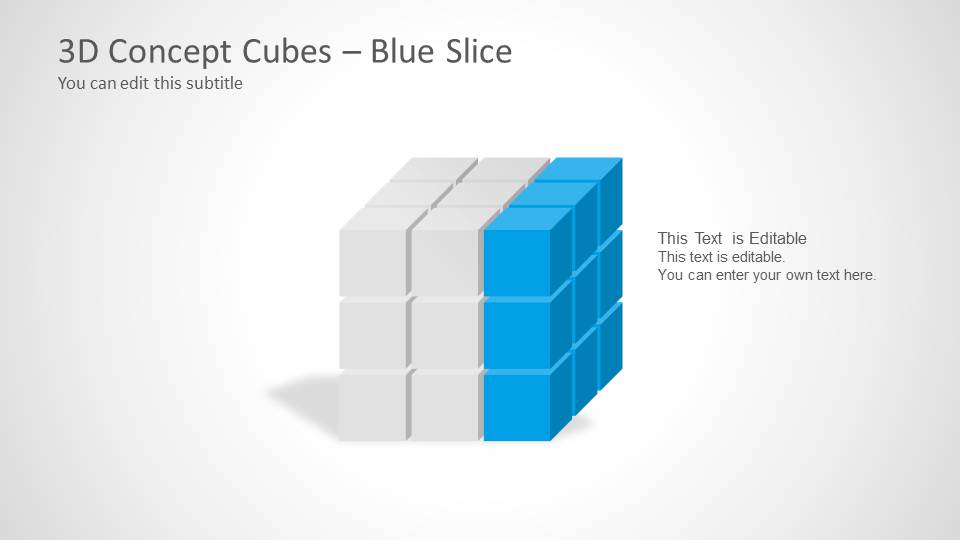
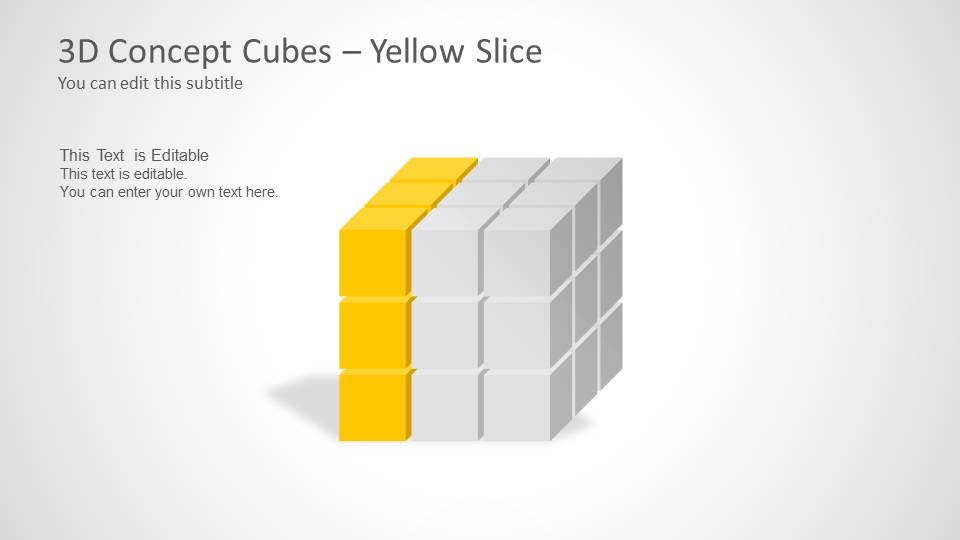
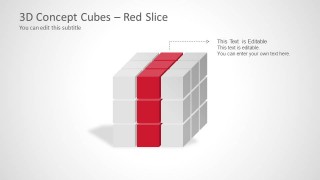
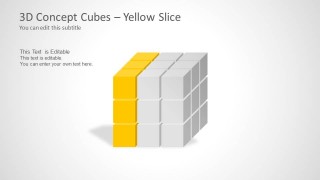
- A business intelligence manager can explain reporting categories to executives by assigning meanings to the blue, red, and yellow cube slices and adding short callout text.
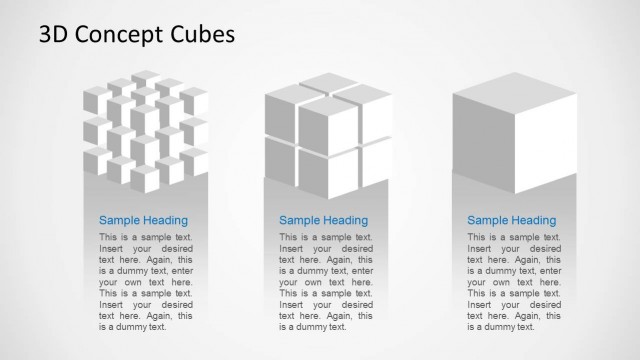
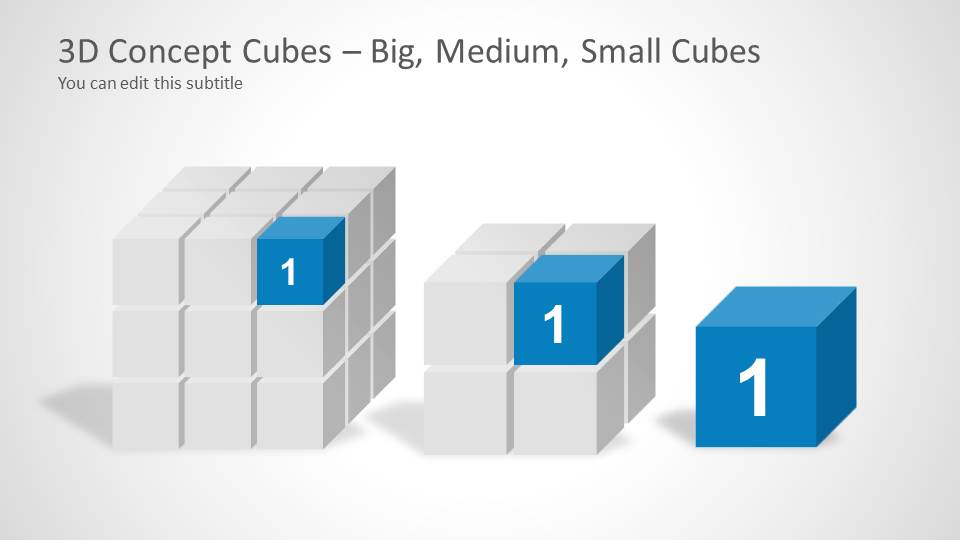
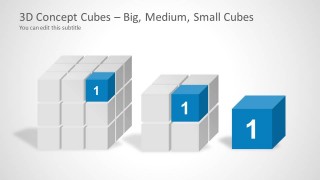
- An analytics consultant can compare relative data volume or system capacity with the big, medium, and small cube layout during a client briefing.
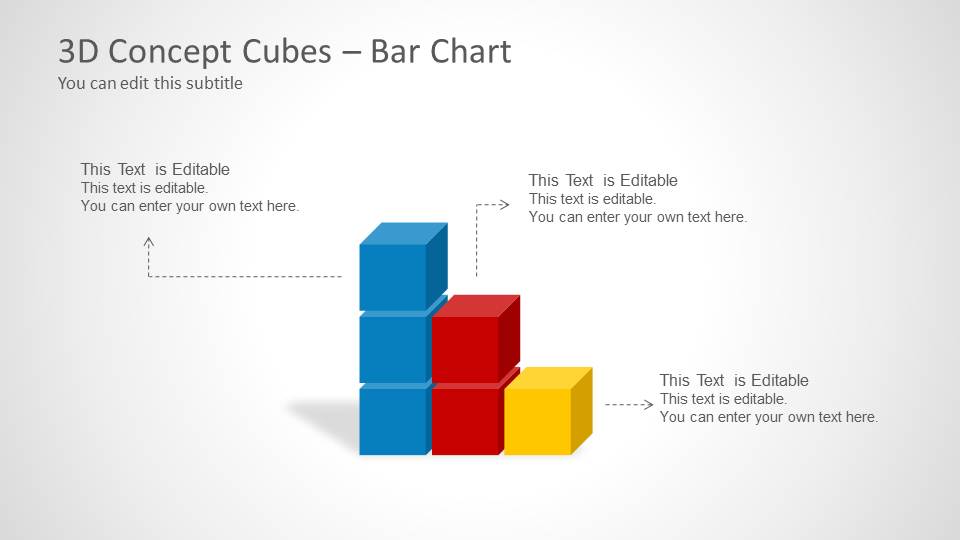
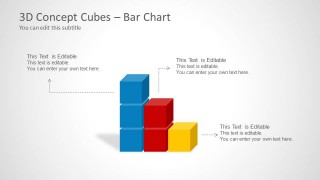
- An IT product presenter can summarize platform metrics with the cube bar chart layout, using the stacked cube columns as a simple comparison visual.
Features
- 100% editable presentation template
- Compatible with Microsoft PowerPoint and Google Slides
- Scalable vector shapes, icons and illustrations
- AI-Ready for Microsoft Copilot and Claude
- Instant access and download
Frequently asked questions
Q: How should a presenter explain a technical big data concept with these cube slides?
A: Start with the full cube as the complete system, then move to one colored slice at a time to isolate a layer, category, or data domain. Keep each callout short and assign one meaning to each color. Use the cube bar chart only after the audience understands what the cube units represent.
Q: Who is this template best suited for in a business presentation?
A: This template fits data, IT, analytics, and business intelligence presenters who need to simplify an abstract structure for managers or clients. It is strongest when the topic involves data warehouses, storage blocks, dimensions, layers, or relative scale. The 3D cube metaphor works better for concept explanation than for detailed statistical reporting.
Q: Why use cube slices instead of a standard process or table layout?
A: The cube slices make a hidden data structure feel physical and easier to separate into parts. A slice can represent a data layer, business domain, or system component while still showing that it belongs to one larger whole. This helps the audience compare parts without losing the overall architecture.

3D Big Data Concept Cubes for PowerPoint
6-slide PowerPoint presentation template with 3D data cubes, slices, and cube bar chart
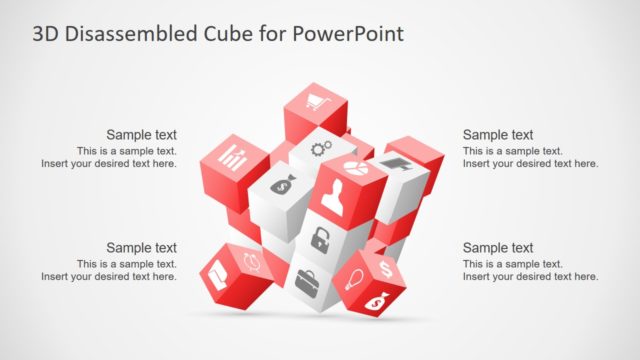
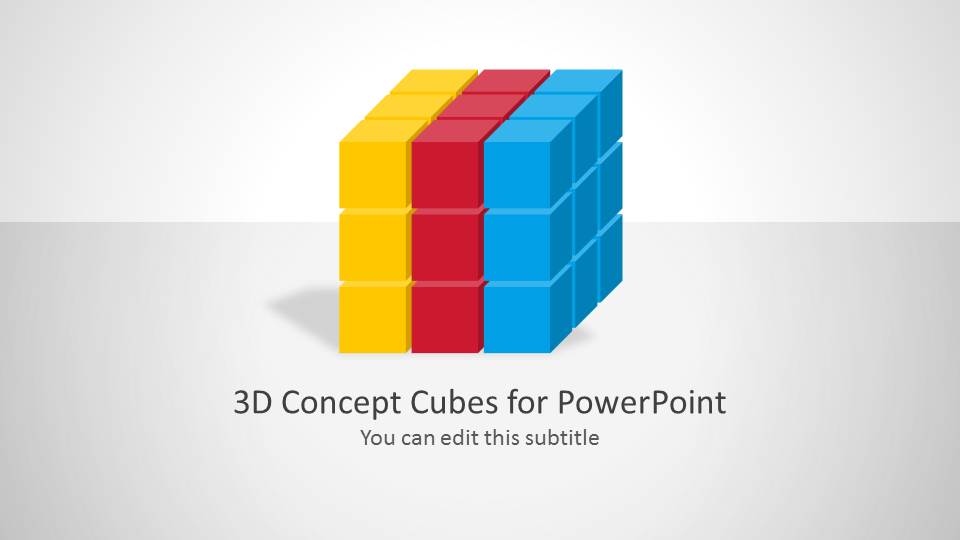
3D Big Data Concept Cubes for PowerPoint is a 6-slide presentation template for explaining data warehouse or analytics concepts through cube metaphors. It includes a full cube cover, blue, red, and yellow slice diagrams, a cube bar chart, and big, medium, small cube comparison layouts for PowerPoint presenters.


 Loading...
 Microsoft PowerPoint
  Microsoft Copilot
  Claude for PowerPoint
 Other formats supported
Subscribe today and get immediate
access to download our PowerPoint templates.