Big Data Diagram PowerPoint Template
Customize our creative Big Data Diagram PowerPoint Template to display the 10 Vs of big data engagingly. Big data deals with large and complex data sets that are obtained from various sources and have the potential to grow exponentially over time. Structured, unstructured, and semi-structured data; thus, all types of data are included in big data. Conventional data processing measures proved to be ineffective when dealing with big data. With modern developments in information technology, the significance of data is more important than ever. Organizations use big data from social media, websites, mobile applications, and other resources to make informed decisions based on the buyer persona. This can help them understand their customers’ perspectives and tailor their marketing strategies accordingly.
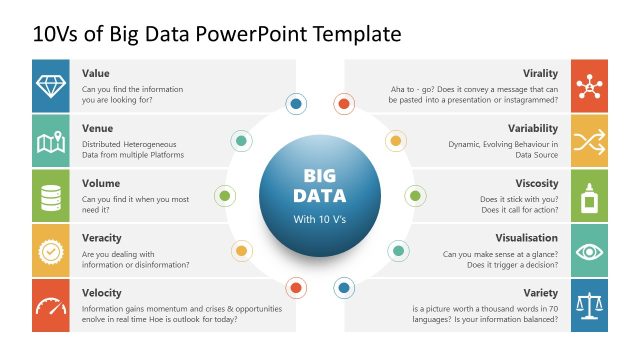
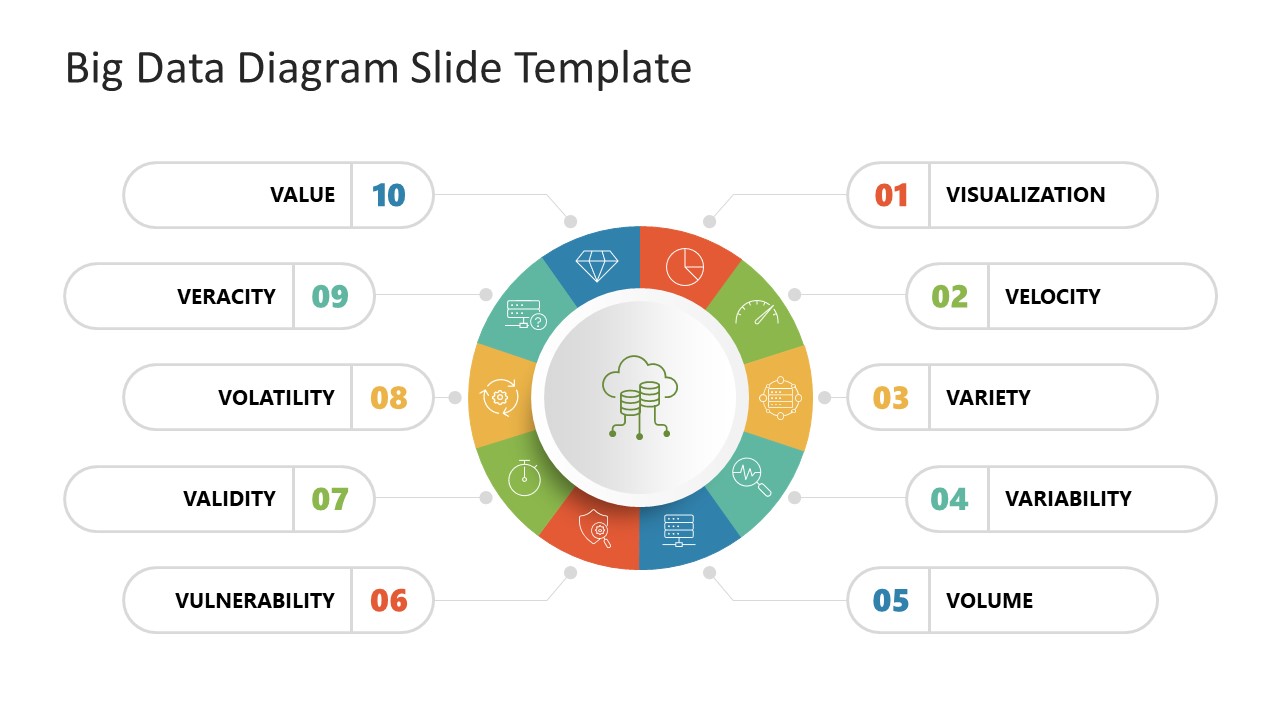
We have created this big data template so data professionals can leverage it for educational and business presentations. Big data has a set of characteristics mostly referred to as Vs of Big data: Visualization, velocity, variety, variability volume, value, integrity, volatility, validity, and vulnerability. Data engineers, data scientists, and analysts can use the data warehousing templates for strategic planning presentations. Moreover, presenters can brief investors and stakeholders about how your company integrates big data into their processes.
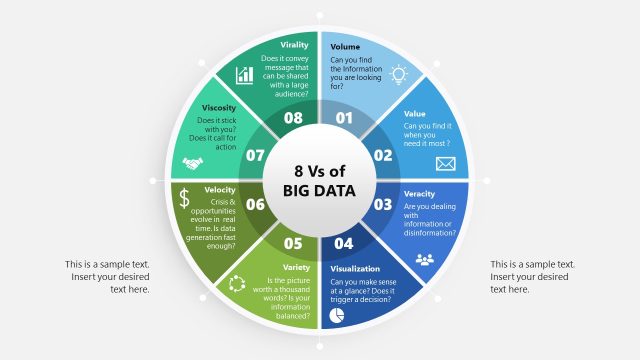
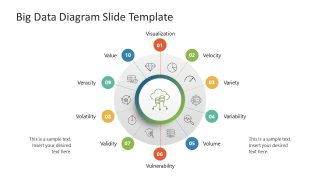
The template consists of two slides with a unique, colorful diagram. The bright color scheme of the diagram engages the audience and captives their attention. The first slide has a circular diagram segmented into 10 parts. Each part contains an infographic icon relevant to the point. We have provided 10 editable text boxes showing the Vs of big data—a line pointer points from the textboxes towards the associated graphical icon in the diagram. In the second slide, each V is displayed along with its circular segment with the corresponding numbers from one to ten. Two additional text boxes are also available in the slide where users can write brief details about the topic.
Utilize this slide template as an artificial intelligence PowerPoint to make interactive presentations displaying the use of big data in AI and cloud computing. Do not wait; download this Big Data Diagram PowerPoint Template and edit it now!

You must be logged in to download this file.
DOWNLOAD- Category
- Diagrams
- Rating

 Loading...
- Size
- 16x9
- Item ID
- 22118-01
- Colors
Subscribe today and get immediate
access to download our PowerPoint templates.