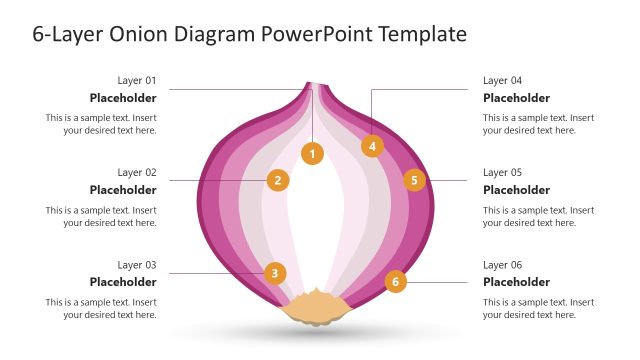
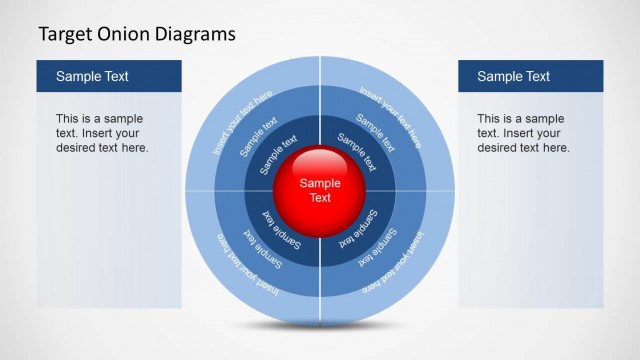
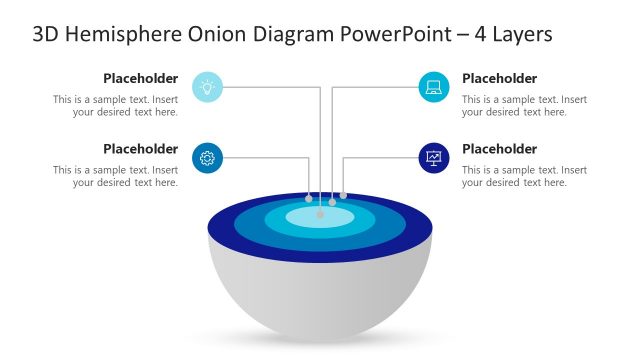
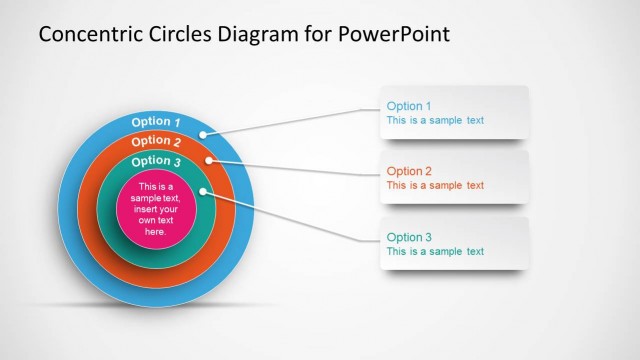
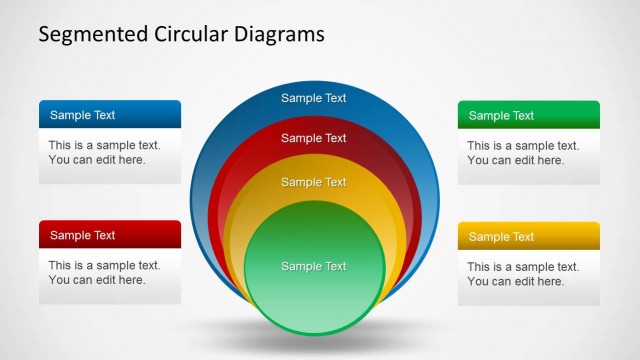
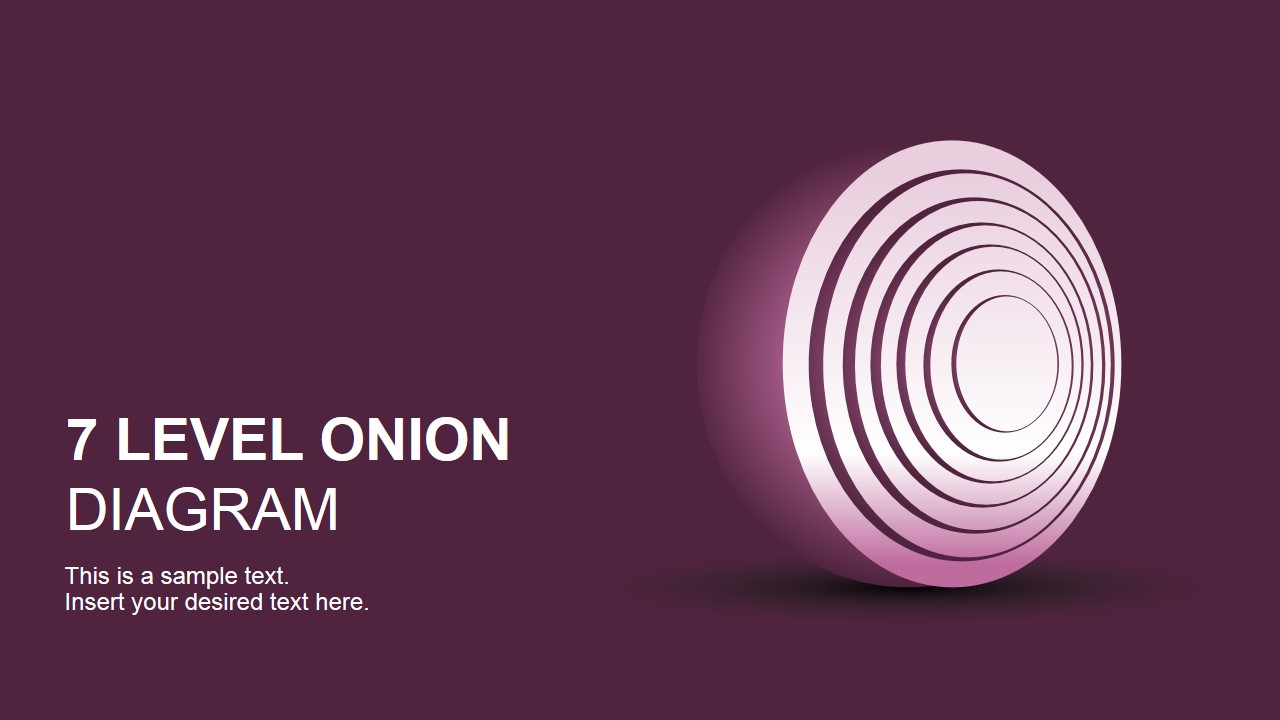
7 Level Onion Diagram Design for PowerPoint is a creative onion diagram for presentations that you can use as an alternative to traditional onion charts with concentric circles. This onion diagram PPT template has a realistic onion illustration as a PowerPoint graphic created with shapes with space to describe up to 7 levels. Also, check our collection of onion diagrams for PowerPoint.
What’s inside this template
Example presentation scenarios
- A strategy consultant can use the onion callout diagram to explain seven layers of a business model, from the outer market context to the core operating principle.
- A training presenter can use the numbered seven-level list to teach a staged framework and give learners a clear reference for each layer.
- A project manager can use the text-panel onion slide to explain how policies, teams, processes, tools, and outcomes connect in a layered operating model.
- A product or technology lead can use the concentric onion diagram to map architecture layers, user needs, or capability tiers in a compact executive briefing.
Features
- 100% editable presentation template
- Compatible with Microsoft PowerPoint and Google Slides
- 16:9 aspect ratio slides
- Scalable vector shapes, icons and illustrations
- AI-Ready for Microsoft Copilot and Claude
- Instant access and download
Frequently asked questions
Q: How should a presenter explain the seven levels without overwhelming the audience?
A: Start with the whole onion metaphor on the cover, then use the callout slide to name each layer in plain language. Keep each label short and move deeper only after the audience understands the outer layer. Use the numbered list at the end as the recap, not as the first explanation.
Q: What type of message is this onion diagram best suited to communicate?
A: This template fits messages where meaning comes from nested layers, such as maturity models, risk structures, stakeholder depth, capability stacks, or root-cause analysis. It is strongest for consultants, managers, and trainers who need to show that the center depends on outer context or that surface issues sit above deeper drivers.
Q: Why use an onion metaphor instead of a standard concentric circle diagram?
A: The onion illustration makes the idea of layers more concrete than flat circles. The sliced visual suggests depth, sequence, and discovery, which helps audiences understand that each level can be peeled back to reveal a deeper factor. The callout labels keep the metaphor organized and easy to follow.




7 Level Onion Diagram Design for PowerPoint
4-slide presentation template with 7-level onion diagram, callouts, and numbered layer list
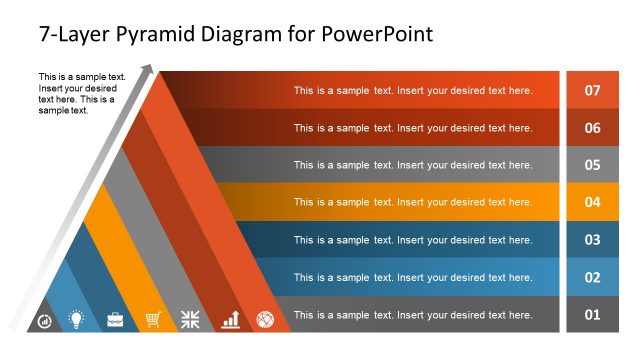
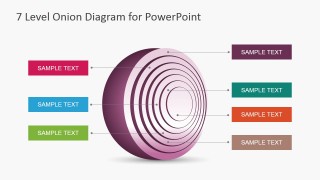
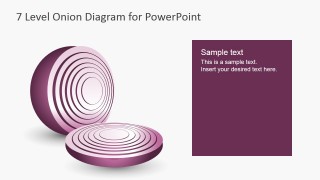
This is a 4-slide presentation template for explaining seven nested levels with a realistic onion metaphor. It includes a title cover, seven-label onion callout diagram, onion illustration with text panel, and numbered seven-level list. It is built for analysts, consultants, and managers using Microsoft PowerPoint or Google Slides.
- Rating


 Loading...
- Aspect ratio
- 16:9
- Item ID
- 6920-01
- Colors
 Microsoft PowerPoint
  Microsoft Copilot
  Claude for PowerPoint
 Other formats supported
Subscribe today and get immediate
access to download our PowerPoint templates.