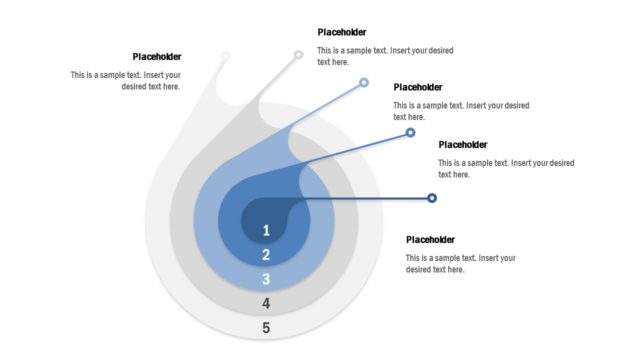
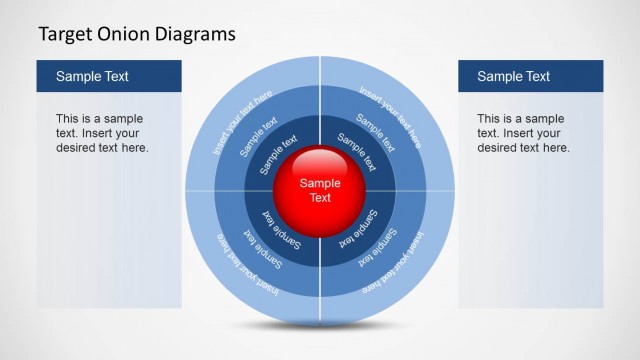
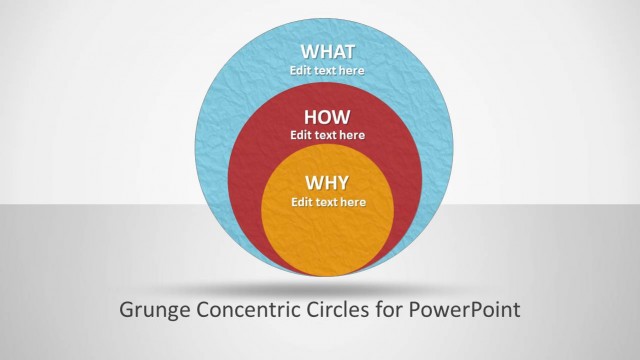
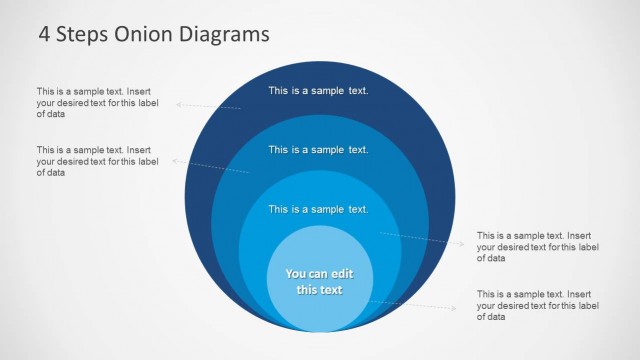
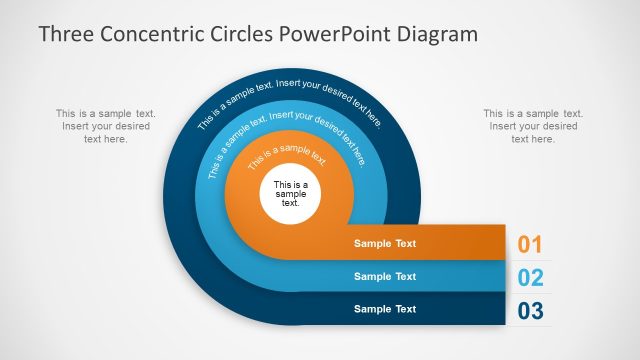
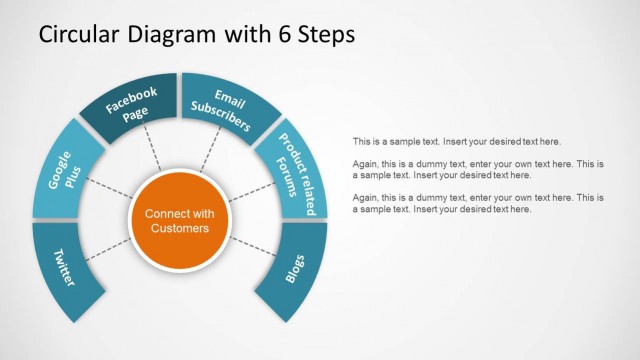
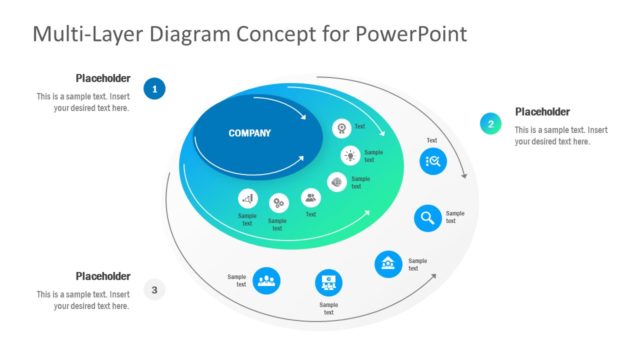
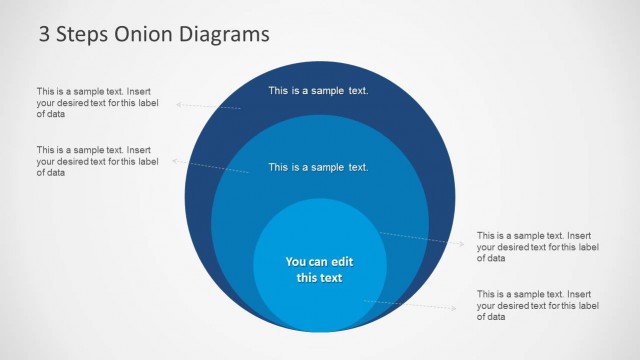
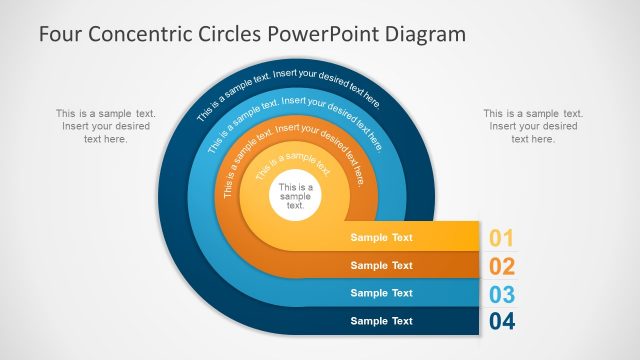
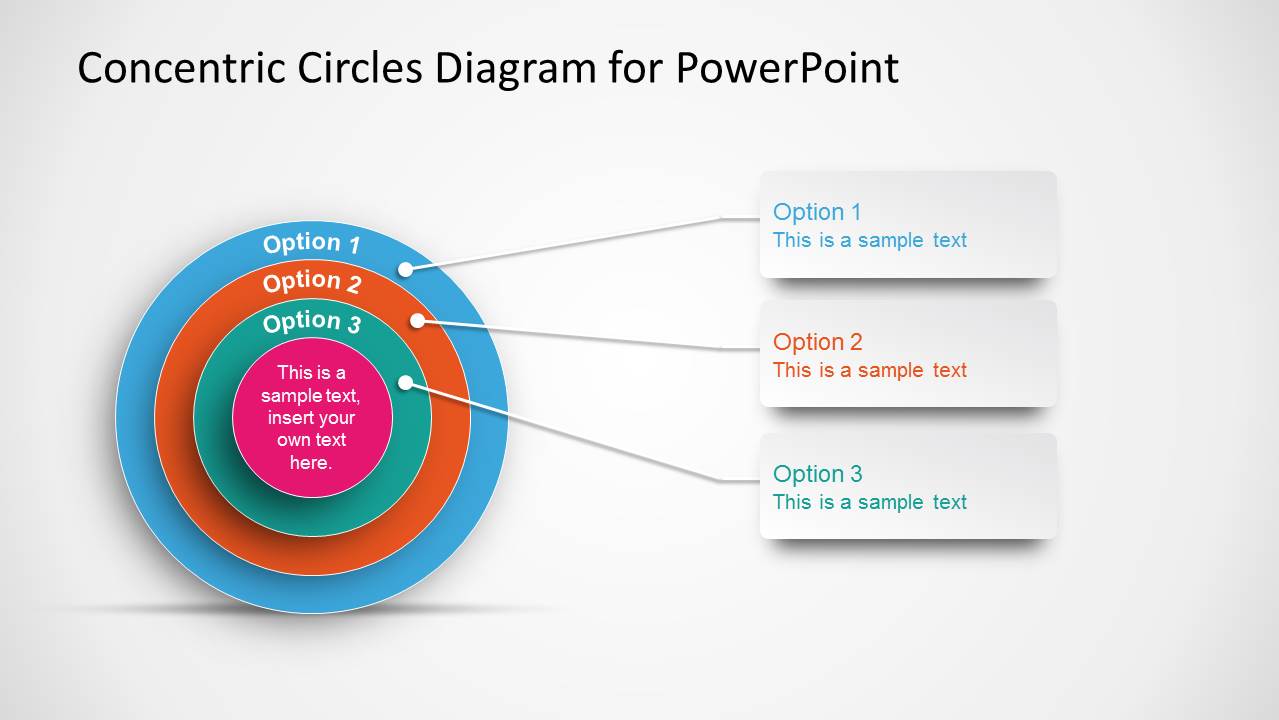
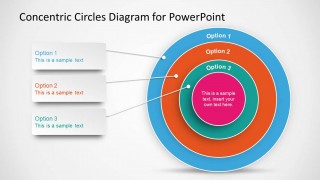
Concentric Circles Diagram Template for PowerPoint is a creative diagram template for Microsoft PowerPoint presentations that you can use to make onion diagrams for your presentation slides. Onion diagrams are able to show layers of a complete system in a few circles. Each circle in an Onion diagram is able to represent a component that is dependent upon the component on the inside of it.
In the center of the concentric circles or onion diagrams the main concept is shown and this chart is widely used to clearly represent a complete system in a PowerPoint presentation that is easy to read and has a strong visual impact.
Ideal for Marketing presentations where the presenter needs to describe Total Market, Total Available Market and Total Achievable Market, this Concentric Circles Diagram Template for PowerPoint will engage the audience with its high quality graphics.
What’s inside this template
Example presentation scenarios
- A marketing strategist can present total market, available market, and achievable market logic using the concentric ring diagram with labeled layers and callout notes.
- A product manager can explain how a core feature connects to surrounding service tiers using the large onion diagram and left-side text boxes.
- A consultant can summarize a layered operating model for executives by placing the main concept in the center and mapping related dependencies outward.
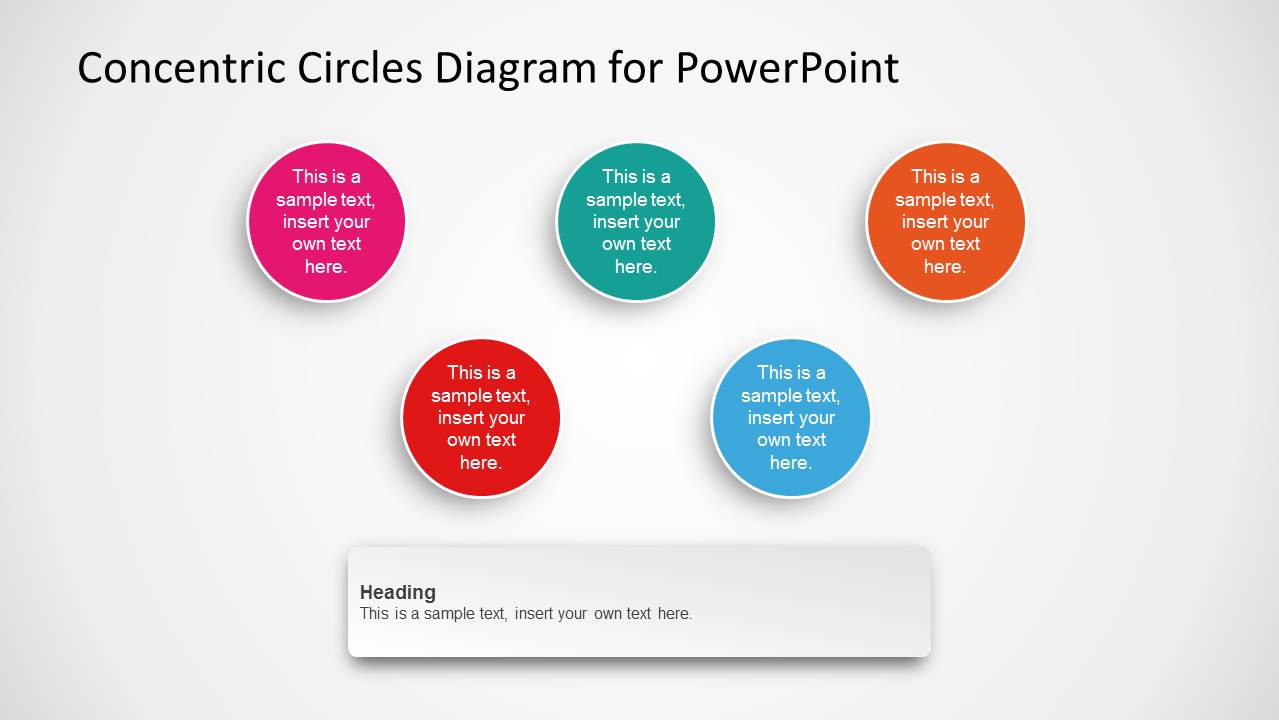
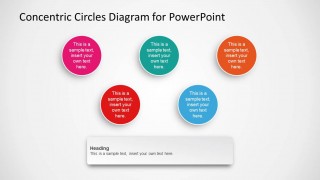
- A business analyst can compare five related themes or stakeholder groups using the standalone colored circle nodes and bottom summary caption.
Features
- 100% editable presentation template
- Compatible with Microsoft PowerPoint and Google Slides
- 16:9 aspect ratio slides
- Scalable vector shapes, icons and illustrations
- AI-Ready for Microsoft Copilot and Claude
- Instant access and download
Frequently asked questions
Q: How should I present a layered concept without making the circles feel abstract?
A: Start with the center circle as the main idea, then define each outer ring as a distinct layer that depends on or surrounds it. Use the callout cards for plain-language explanations, not long paragraphs. Keep one message per ring so the audience can follow the relationship between core concept, supporting layers, and outer context.
Q: Who is this diagram best suited for in a business presentation?
A: This template fits presenters who need to explain structure rather than detailed numbers. Marketing teams can use it for market sizing layers, consultants can show operating model levels, and product leaders can describe core capabilities with surrounding services. It works best when the message is about hierarchy, containment, or dependency.
Q: Why use concentric circles instead of a list or table?
A: Concentric circles create a visual metaphor for an onion, with the core idea at the center and related layers expanding outward. That structure helps the audience see which concept is foundational and which items sit around it. Lists describe order, but this diagram shows containment and relationship in one view.

Concentric Circles Diagram Template for PowerPoint
3-slide presentation template for onion diagrams, concentric circles, and layered business concepts
The Concentric Circles Diagram Template for PowerPoint is a 3-slide diagram template for explaining layered systems and dependency relationships. It includes an onion diagram with right-side callouts, a large concentric circle layout with left-side notes, and a set of standalone colored circles. It is designed for business, marketing, and strategy presentations in Microsoft PowerPoint and Google Slides.
- Category
- Diagrams
- Rating


 Loading...
- Aspect ratio
- 16:9, 4:3
- Item ID
- 2011-01
- Colors
 Microsoft PowerPoint
  Microsoft Copilot
  Claude for PowerPoint
 Other formats supported
Subscribe today and get immediate
access to download our PowerPoint templates.