3 Steps Onion Diagrams for PowerPoint
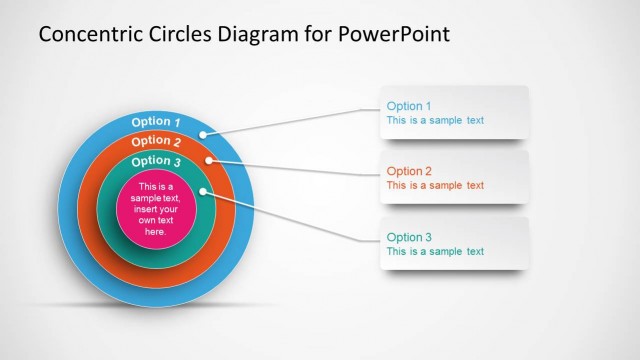
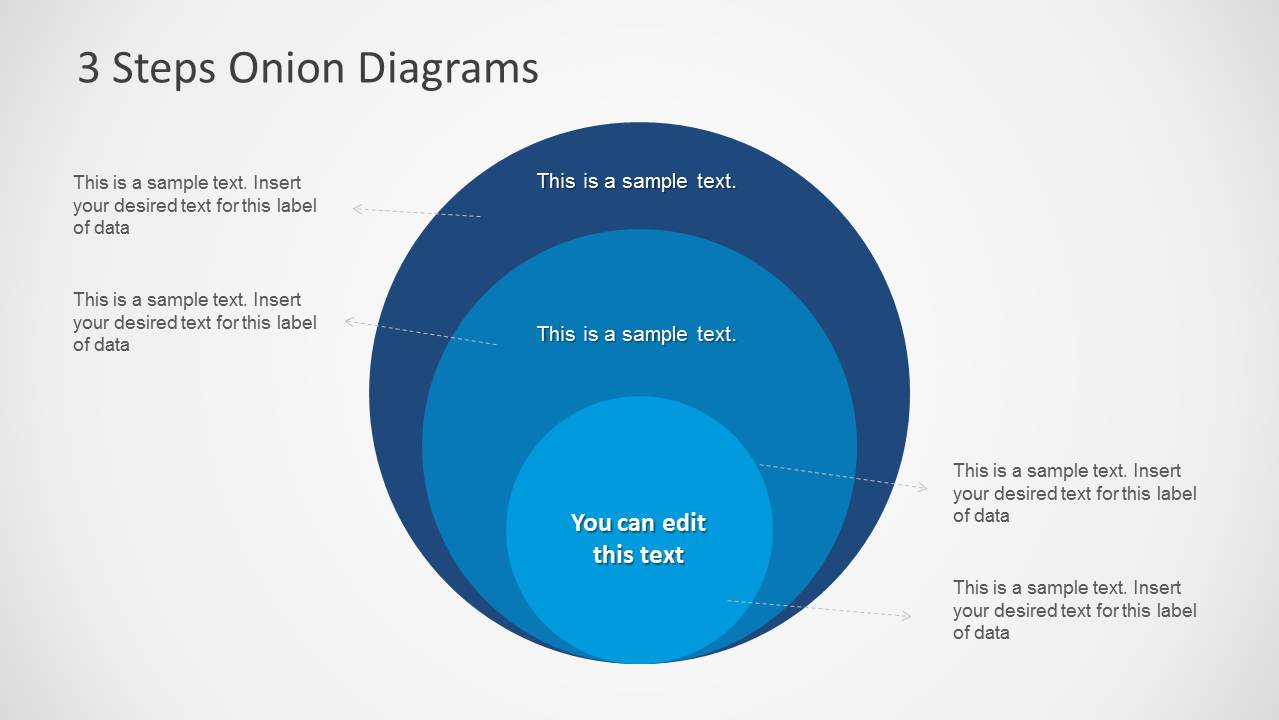
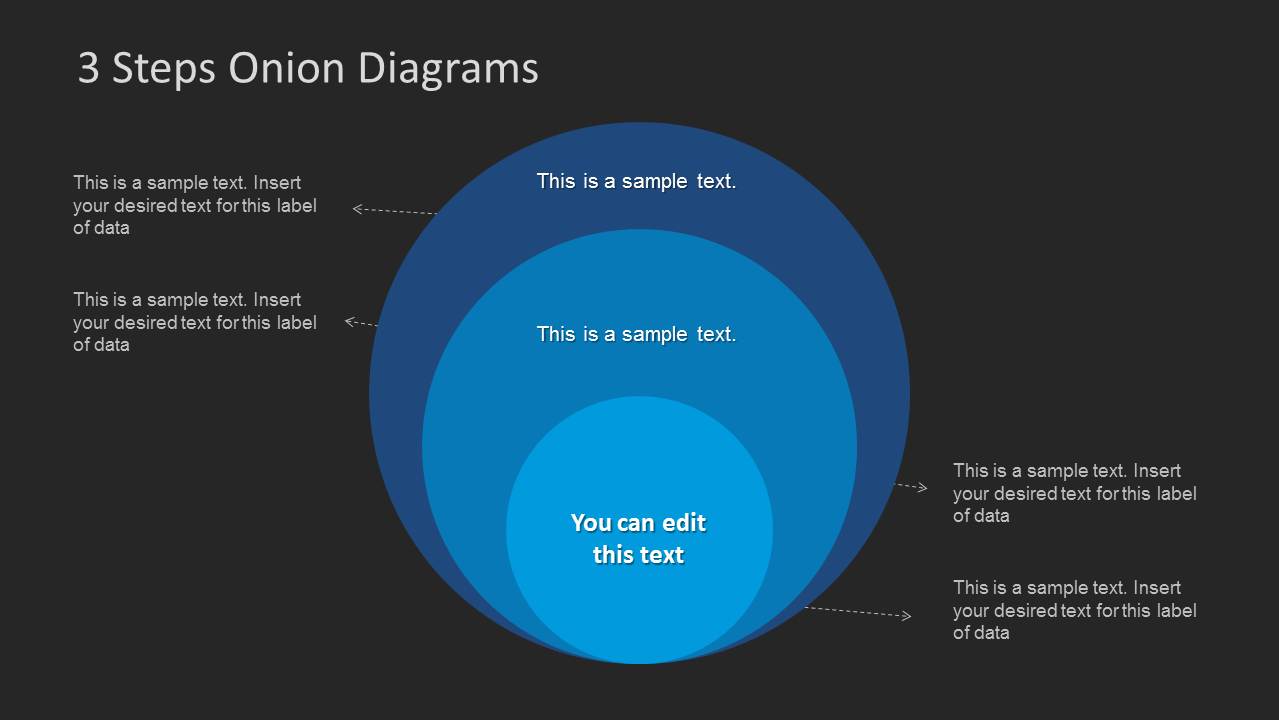
3 Steps Onion Diagrams for PowerPoint is an editable & simple Onion diagram with three levels that you can use to represent business models in your PowerPoint presentations.
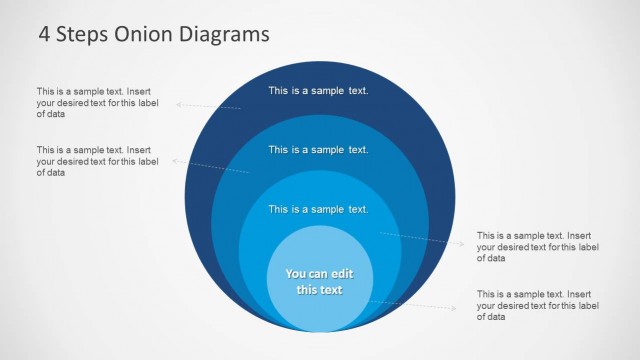
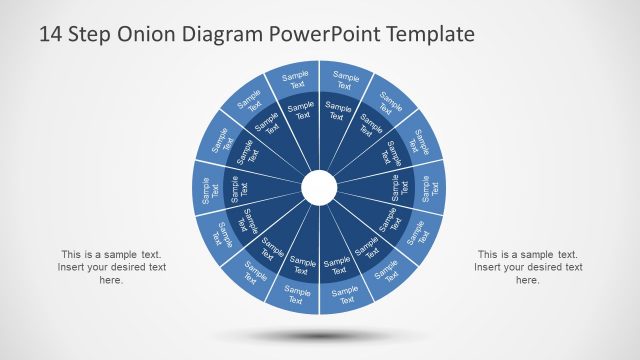
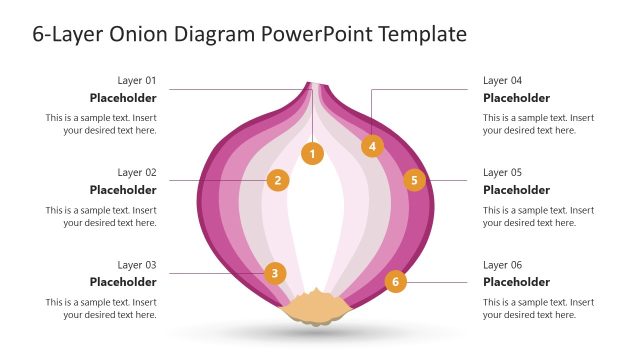
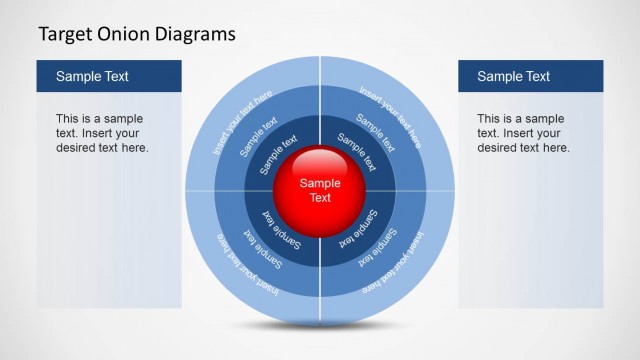
Onion diagrams are used to represent a system within concentric circles. Using circles inside, you can use onion diagrams to represent a component dependent on other inner components. Onion diagrams are used as a visual representation and help share a message in a PowerPoint presentation.
This 3-step Onion Diagram PowerPoint template lets you easily create a basic Onion Diagram of up to 3 steps for PowerPoint presentations or Google Slides. It uses PowerPoint shapes with a clear visual representation to make a strong visual impact.
You can use Onion Diagrams in business presentations and other areas of interest, including Business Analysis Planning & Monitoring. For example, you can use the Onion Diagram to conduct a business stakeholders analysis and present the results in a PowerPoint presentation. The stakeholder presentation can display a Stakeholder Onion Diagram with different circles representing the layers or stakeholders in an organization.
Alternatively, you can download other onion diagram template slides for PowerPoint & Google Slides presentations, including Venn Diagrams for presentations.
You must be logged in to download this file.
DOWNLOAD- Category
- Diagrams
- Rating

 Loading...
- Size
- 16x9
- Item ID
- 6131-03
- Colors
Subscribe today and get immediate
access to download our PowerPoint templates.