Slide 5 of 6 from 3D Big Data Concept Cubes for PowerPoint
6018-02-3d-concept-cubes-bigdata-5
3D Concept Cubes - Bar Chart Slide
- Chart
- Bar Vertical
- Evaluation Slide
- 16:9
- 100% Editable
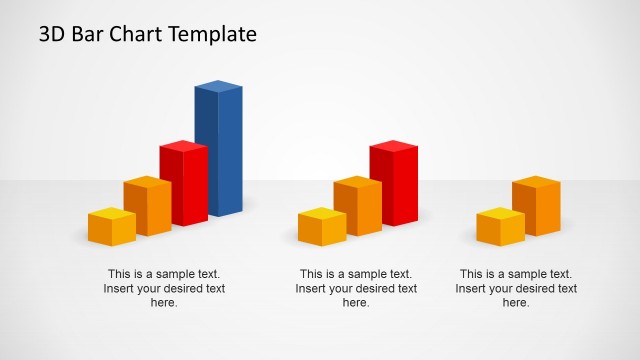
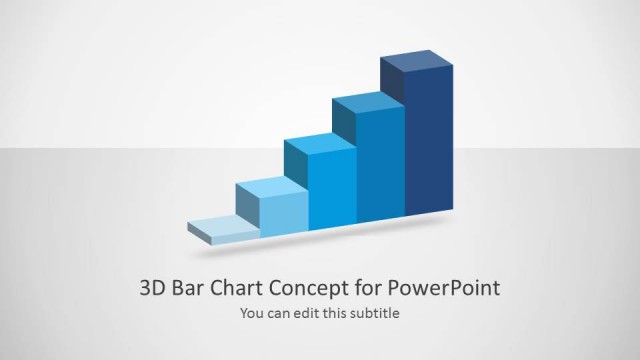
The 3D Concept Cubes - Bar Chart slide from the 3D Big Data Concept Cubes for PowerPoint template offers a clear visual for comparing performance metrics and sales analysis. This slide layout uses editable shapes and vector icons arranged as stacked cubes to enhance data presentation in business presentations and pitch deck templates. It supports effective communication of quantitative insights with a focus on data comparison using professional slide templates.
What’s on This Slide
The slide features a 3D bar chart composed of three colored cubes: blue, red, and yellow. The cubes are stacked in a vertical arrangement, with the blue cube on top, followed by the red and yellow cubes. Text placeholders are positioned around the cubes, with one above, one to the right, and one below, all aligned to the center. The background is a light gradient, enhancing the visibility of the cubes. The visual hierarchy emphasizes the cubes, while the text placeholders are secondary elements, allowing for easy editing.
How to Use It
This layout serves as a bar chart representation, ideal for comparing data across categories. It fits well in a presentation sequence that discusses analytics or data visualization. Business scenarios include showcasing performance metrics, sales figures, or project comparisons. This structure allows for clear communication of quantitative information, making it suitable for reports or presentations focused on data-driven insights.
Text Placeholders & Capacity
Keep your copy within these limits so it fits without resizing. Node body slots can hold around 8-10 words each.
| Placeholder | Count | Max characters (approx.) |
|---|---|---|
| Chart title | 1 | 30 |
| Subtitle | 1 | 50 |
| Item body | 3 | 50 |
Slide Keywords
Download unlimited PowerPoint templates, charts and graphics for your presentations with our annual plan.
DOWNLOADReturn to 3D Big Data Concept Cubes for PowerPoint.