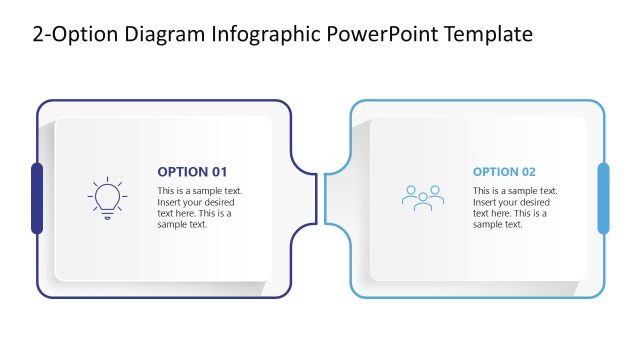
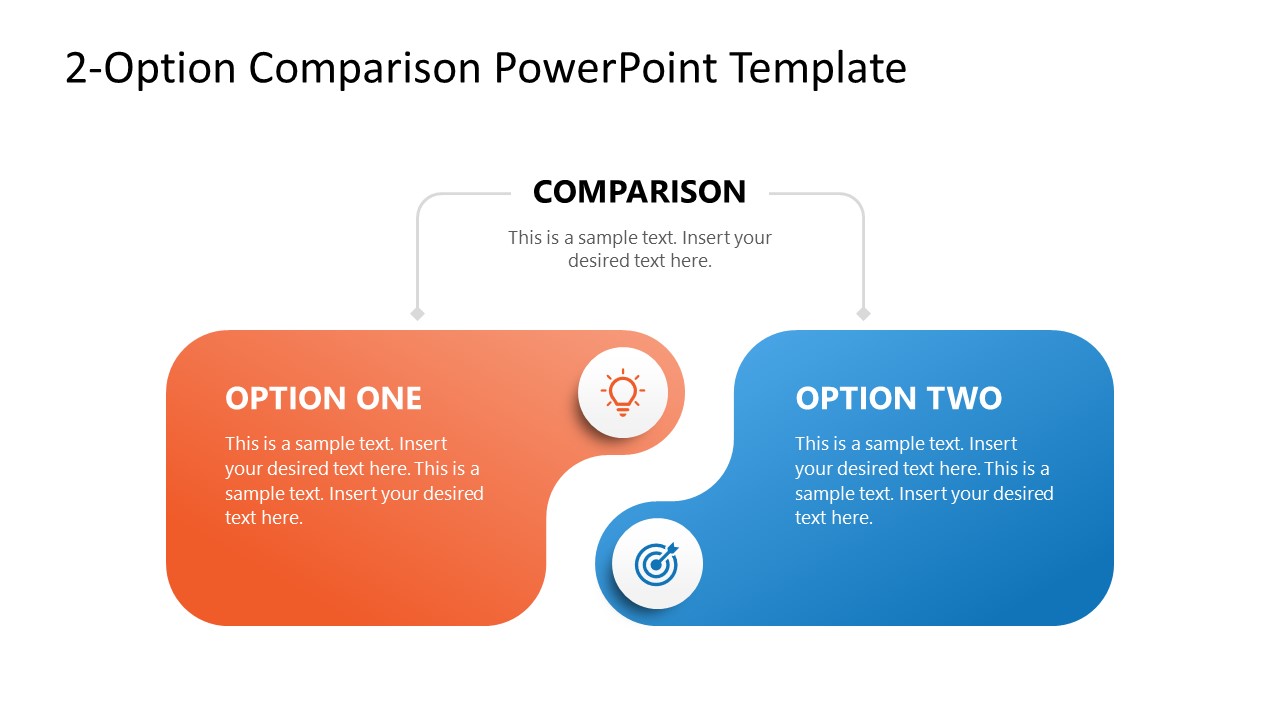
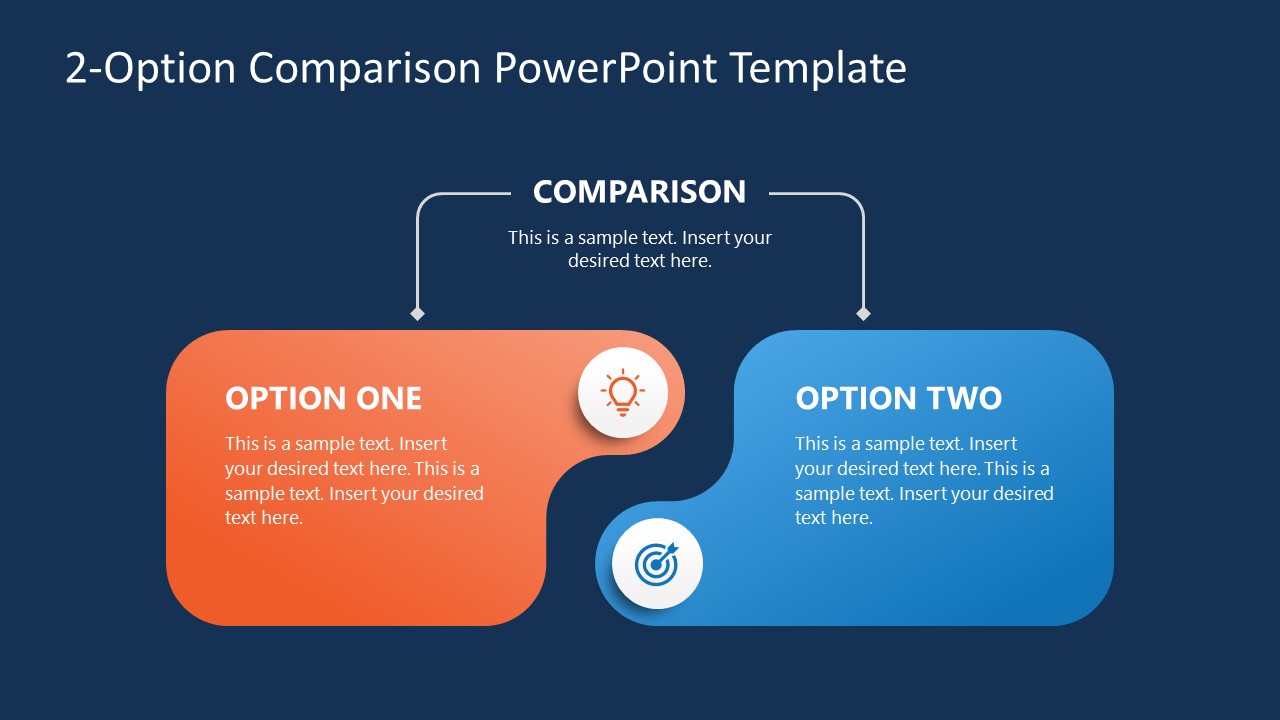
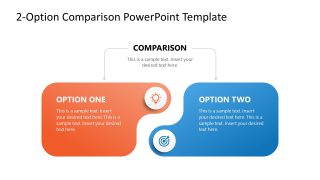
Visualizing the relationship between two competing variables requires more than a basic split-screen. This 2-Option Comparison PowerPoint Template utilizes an interlocking “jigsaw” geometry designed to highlight the friction or alignment between distinct data sets. Whether you are conducting a Competitive Benchmarking session or a Current-State vs. Future-State gap analysis, this layout provides a clear focal point for stakeholder decision-making by mapping two options onto a single, unified plane.
The design is engineered to facilitate high-clarity comparisons across various professional workstreams:
- Competitive Benchmarking: Compare your product’s feature set with that of a primary market rival to identify unique value propositions.
- A/B Testing & Campaign Analysis: Map performance deltas across marketing channels, such as Performance Max vs. Search Ads, to optimize budget allocation.
- Methodology Evaluation: Present a side-by-side breakdown of project execution frameworks (e.g., Agile vs. Waterfall) to determine the best fit for project scope.
- Strategic Pivots: Compare a legacy business model against a proposed digital transformation initiative to visualize necessary operational shifts.
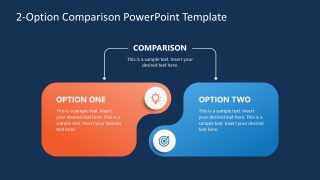
This comparison presentation template focuses on the Bimodal Information Hierarchy, using high-contrast orange and blue nodes to clearly delineate Option A and Option B without creating visual clutter. The PPTX file includes a premium dark theme specifically optimized for high-end digital environments and low-light presentation rooms, ensuring your data remains the focal point. Every component, from the target and lightbulb icons to the rounded containers, is a fully editable vector asset, allowing for precise scaling in 16:9 widescreen format across any Microsoft PowerPoint version. This PPT layout eliminates the need for manual reformatting, enabling you to transition from high-level Binary Analysis to a granular deep dive while maintaining complete visual continuity.
Stop presenting data in isolation. Download the 2-Option Comparison PowerPoint Template to bring a balanced, analytical perspective to your next strategic review.
What’s inside this template
Example presentation scenarios
- A product manager can compare two feature packages for an executive decision meeting using the orange and blue option blocks to separate benefits, risks, and fit.
- A marketing analyst can present an A/B campaign result by placing each campaign in one jigsaw block and using the comparison bracket header to frame the decision criteria.
- A consultant can explain current state versus future state during a strategy workshop by assigning the legacy model to Option One and the proposed model to Option Two.
- A project manager can compare two delivery methods, such as internal execution versus vendor support, using the icon callouts to mark the main insight for each side.
Features
- 100% editable presentation template
- Compatible with Microsoft PowerPoint
- 16:9 aspect ratio slides
- Scalable vector shapes, icons and illustrations
- AI-Ready for Microsoft Copilot and Claude
- Instant access and download
Frequently asked questions
Q: How should a presenter structure the message on this two-option comparison diagram?
A: Start with the top comparison header as the decision question, not a generic label. Put the first alternative in the orange block and the second in the blue block, using parallel wording so the audience can scan the difference quickly. Keep each text block to the same type of evidence, such as cost, benefit, risk, or expected outcome.
Q: What type of presentation is this template best suited for?
A: This template fits short decision moments where the audience must choose between two paths, products, campaigns, or operating models. It is especially useful for product managers, consultants, marketers, and project leads who need one clean visual instead of a long list of pros and cons.
Q: Why use an interlocking jigsaw layout instead of a standard side-by-side table?
A: The jigsaw geometry shows that the two choices are connected, not isolated. The center interlock creates visual tension where differences or trade-offs meet, while the lightbulb and target icons give each side a memorable idea marker. This helps the audience compare options while still seeing the shared decision context.
2-Option Comparison PowerPoint Template
2-slide PowerPoint presentation template for option comparison diagrams with jigsaw blocks and icon callouts
The 2-Option Comparison PowerPoint Template is a 2-slide, 16:9 diagram template for Microsoft PowerPoint. It includes a two-option jigsaw comparison layout in light and dark versions, with a comparison bracket header, editable text blocks, and vector icon callouts for lightbulb and target concepts. It suits strategy, product, and marketing presenters.
- Category
- Diagrams
- Rating

 Loading...
- Aspect ratio
- 16:9
- Item ID
- 23519-01
- Colors
 Microsoft PowerPoint
  Microsoft Copilot
  Claude for PowerPoint
 Other formats supported
Subscribe today and get immediate
access to download our PowerPoint templates.