Showcase contrasting information between two ideas or initiatives in the meetups using our 2-Option Diagram Infographic PowerPoint Template. This options diagram template includes fully customizable components that users can edit to suit their needs. They can also customize it with Google Slides. This single-slide template helps project managers highlight the two main phases of the project lifecycle. Before launching a new marketing campaign, marketers can discuss the two campaign objectives that can help their brand grow or boost sales. Users can also demonstrate the two business models aimed at achieving an innovative outcome. In problem-solving sessions or root-cause analysis presentations, professionals can use this template to present two solutions to eliminate the problem’s root cause. Some of the additional use cases of this template are:
- Tech experts can discuss the two types of innovative implementations to boost business growth.
- Scholars, mentors, and trainers can use our 2-option diagram template to present two ways of personal development.
- In strategy planning sessions, our template allows users to present two types of inbound or outbound strategies for the company.
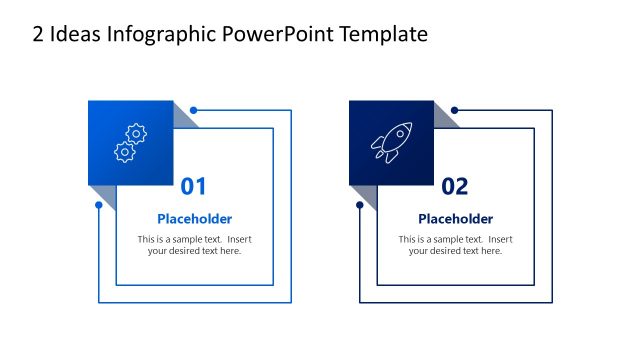
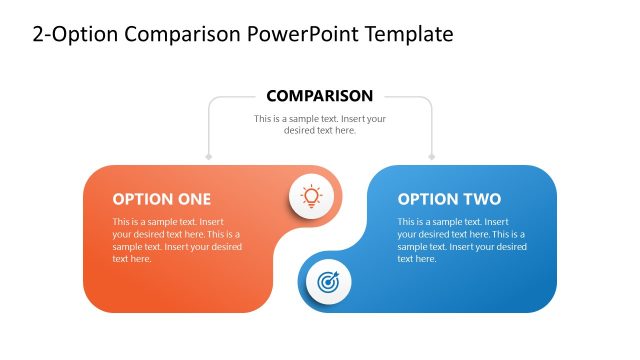
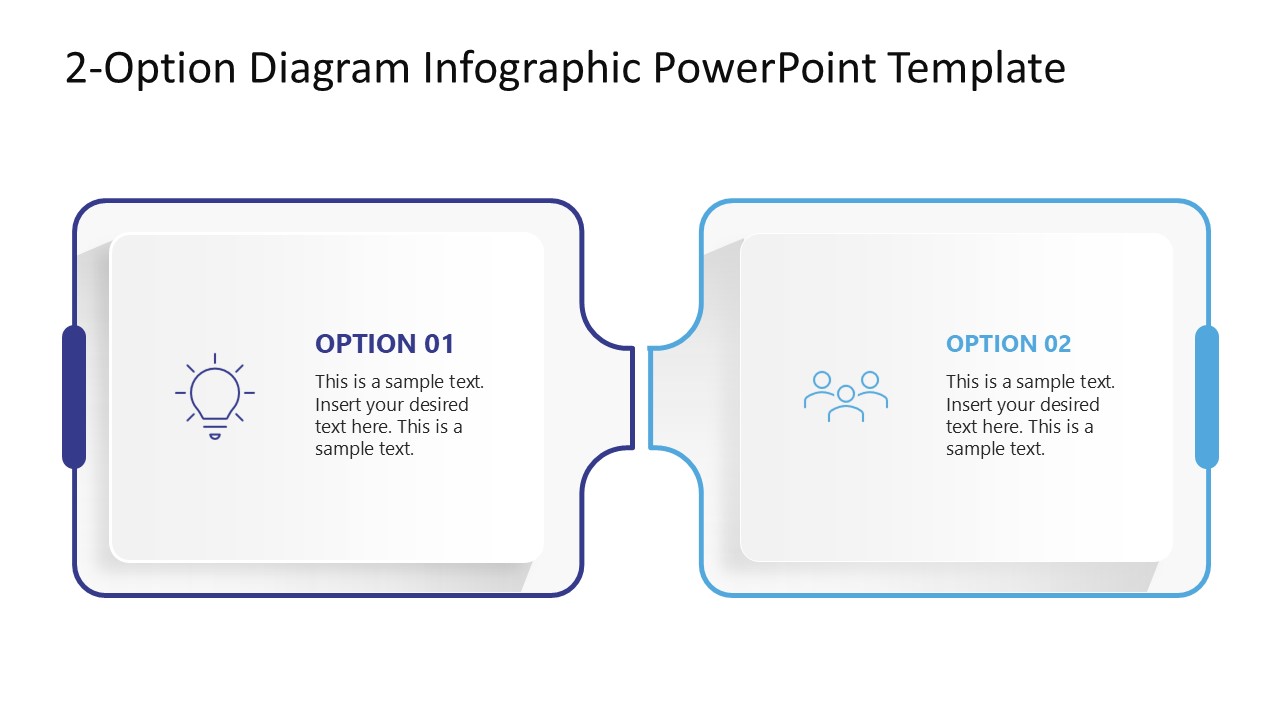
The 2-Option Diagram Infographic PowerPoint Template features a modern diagram of two square boxes placed adjacent to each other. On the inner sides, they have small curved ends that connect the two blocks. Each box has a colored outline, an infographic icon, an option heading, and placeholder text for description presentation. Users can change the infographics based on the topic of discussion. Also, you can modify the fonts of text placeholders to match your specific theme needs.
Download the 2-option diagram template for business meetings and edit it to showcase your ideas clearly! Alternatively, you can download other infographic PPT slides and comparison slide templates for PowerPoint & Google Slides presentations, including comparison tables, side by side layouts, A vs B slides and more.
What’s inside this template
Example presentation scenarios
- A project manager can use the two rounded option cards to explain two project phases and keep the discussion focused on the main responsibilities in each phase.
- A marketing presenter can compare two campaign objectives by replacing the icons and writing concise supporting text under each option heading.
- A strategy consultant can show two business models or strategic routes and use the central connector to signal that both options belong to the same decision space.
- A trainer or educator can introduce two learning paths, methods, or development approaches using the icons as quick visual labels for the audience.
Features
- 100% editable presentation template
- Compatible with Microsoft PowerPoint and Google Slides
- 16:9 aspect ratio slides
- Scalable vector shapes, icons and illustrations
- AI-Ready for Microsoft Copilot and Claude
- Instant access and download
Frequently asked questions
Q: How should I present the two options without making the slide feel like a list?
A: Frame the slide title as the decision or topic, then keep both option cards parallel. Use the same text length, the same level of detail, and matching icon logic for Option 01 and Option 02. This lets the audience compare the two choices quickly instead of reading unrelated blocks of text.
Q: Who is this two-option diagram best suited for?
A: It fits presenters who need a fast, balanced comparison rather than a detailed decision model. Project managers can compare phases, marketers can contrast objectives, consultants can present two strategic paths, and trainers can explain two methods. The layout works best when each option can be summarized in a short heading and brief description.
Q: Why does the connected two-card design help the audience understand the message?
A: The two rounded cards create equal visual weight, so neither option appears dominant by default. The central connector shows that the choices are related parts of one topic, while the icons provide a quick mental label. This structure supports comparison without forcing the presenter into a dense table.

2-Option Diagram Infographic PowerPoint Template
1-slide presentation template for two-option comparisons with rounded boxes, icons, and text placeholders
The 2-Option Diagram Infographic PowerPoint Template is a 1-slide comparison diagram for presenting two alternatives in Microsoft PowerPoint or Google Slides. The slide shows paired rounded option cards, a central connector, line icons, headings, and text boxes for business choices, project phases, campaign objectives, or solution comparisons.
- Category
- Diagrams
- Rating

 Loading...
- Aspect ratio
- 16:9
- Item ID
- 23383-01
- Colors
 Microsoft PowerPoint
  Microsoft Copilot
  Claude for PowerPoint
 Other formats supported
Subscribe today and get immediate
access to download our PowerPoint templates.