Competitive Analysis PowerPoint Templates & Presentation Slides
Step up your business analysis game with our Competitive Analysis presentation templates, fully compatible with PowerPoint & Google Slides presentations. Whether you are presenting to clients, investors, or colleagues, these professionally designed templates for competitors analysis will help you present the analysis of your competition to an audience of stakeholders.


Before & After Slides Template for PowerPoint

Go-to-Market Strategy PowerPoint Template

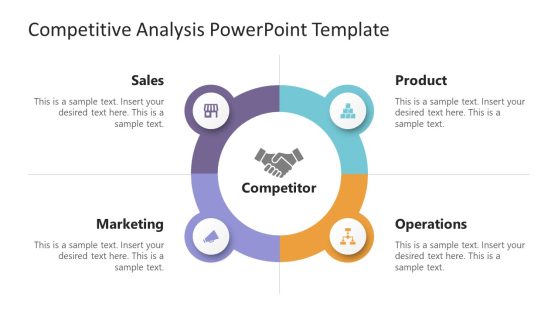
Competitive Analysis PowerPoint Template
Industry Analysis PowerPoint Template

Cost Comparison PowerPoint Template

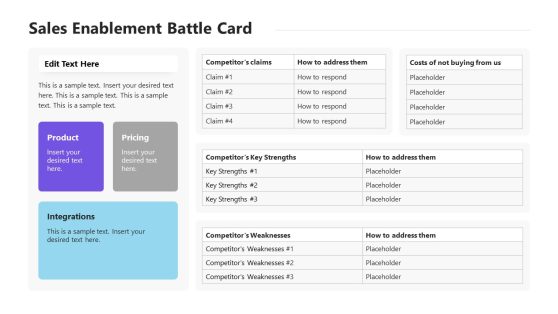
Competitor Analytics PowerPoint Template
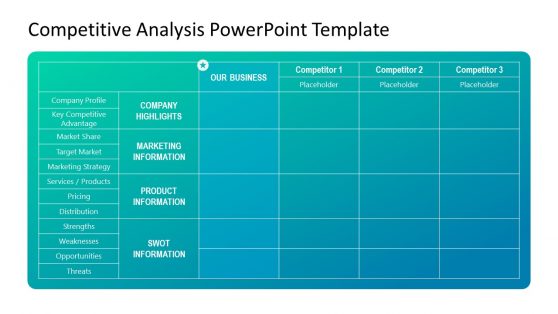
Competitive Analysis PowerPoint Template
Whether you need to showcase market research, compare competitors, or analyze industry trends, our templates have you covered.
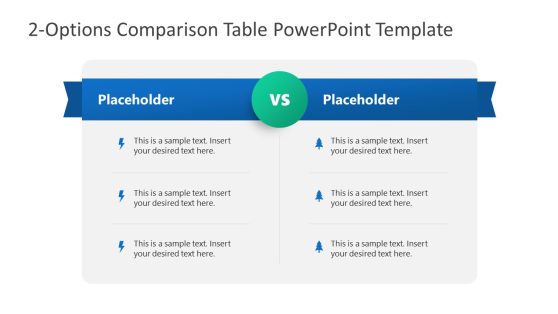
Gain a competitive edge in your industry with a Competitor Comparison Chart. This powerful tool lets you easily compare your business with its competitors and identify improvement areas. With customizable charts that include market share, revenue, and product features, you’ll quickly have a comprehensive view of your industry landscape.
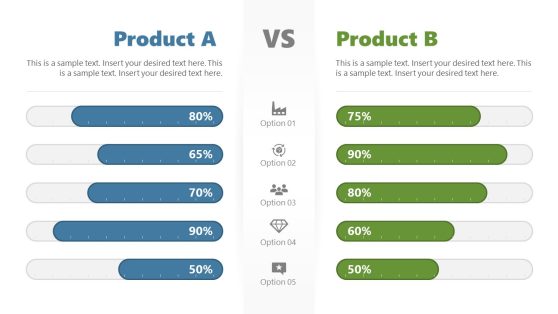
Our templates make creating a Competitor Comparison Chart faster. Input your data and choose from various chart types, including bar graphs, line graphs, and radar charts, to find the best representation for your data. You can add your company’s branding and design elements to make it unique. You can also choose various color schemes and fonts to create a chart that perfectly matches your brand image.
So why settle for mediocre performance in a crowded market when you can use our Competitor Comparison Chart to gain a competitive edge? With easy-to-use templates and powerful insights, you can make informed decisions that drive your business forward. Download now and start taking control of your industry. Download now and get ahead of the competition.
Alternatively, you can download other PPT templates or learn how to how to present a competitive landscape slide in a business presentation or pitch deck.
What is a Competitive Analysis Chart?
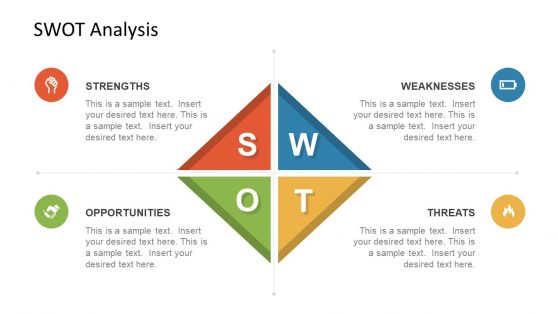
A Competitive Analysis Chart is a tool to compare your business with its competitors visually. It helps you identify the market’s strengths, weaknesses, opportunities, and threats. It provides a clear overview of how your business compares to others in the same industry.
What is the best chart for Competitor Analysis?
This entirely depends on the type of data you are presenting. Common chart types for competitor analysis include bar graphs, line graphs, radar charts, and bubble charts. Bar and line graphs are useful for comparing data over time, while radar charts are great for comparing multiple data points simultaneously. Bubble charts are useful for comparing multiple variables at once.
How do you make a Competitive Analysis Chart?
Firstly, you must determine the factors you want to compare to make a competitive analysis chart. Then gather data on each factor for your business and your competitors. Choose the chart type that best represents your data and input the data into the chart. Finally, customize the chart by adding labels, colors, and other design elements to make it attractive.
What is a Competitor Comparison Chart?
A Competitor Comparison Chart is a competitive analysis chart that compares your business with its competitors. It can include various factors such as market share, revenue, product features, pricing, customer satisfaction, and more. The chart is useful for identifying areas where your business can improve and develop strategies to gain a competitive advantage.