Free Ultra Analysis Slide Template
Download Free Ultra Analysis Slide Template & Google Slides
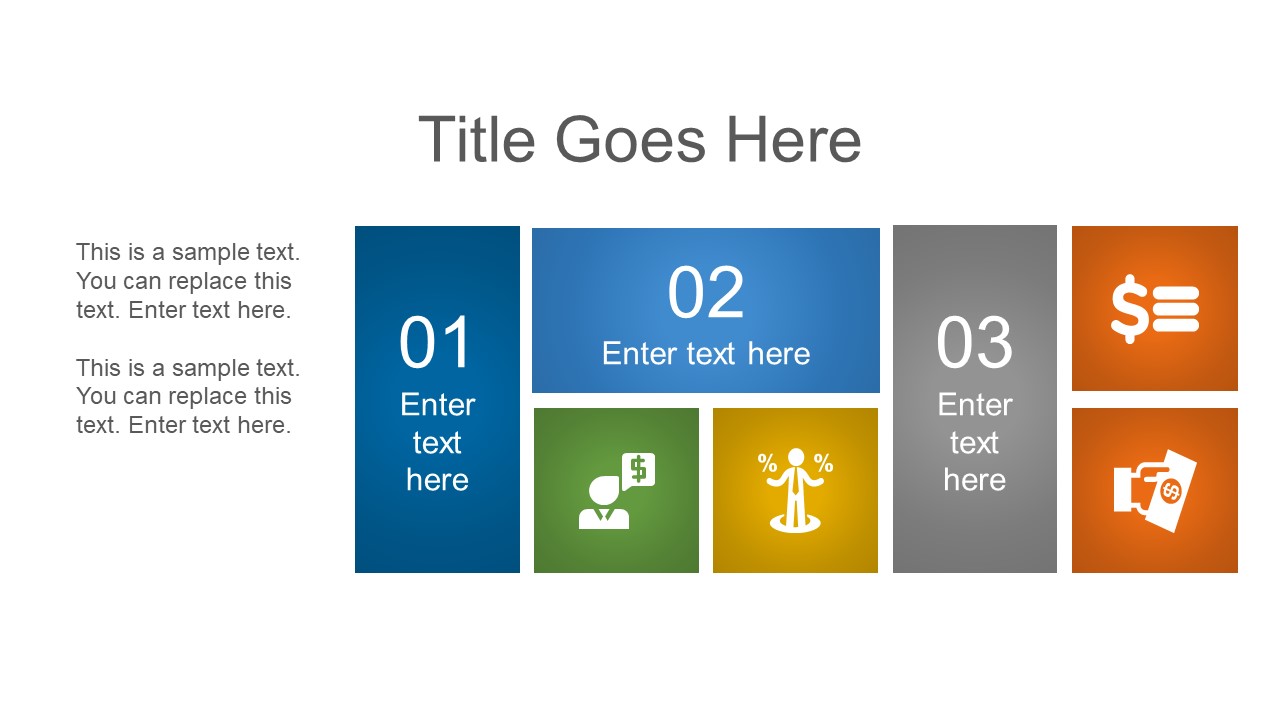


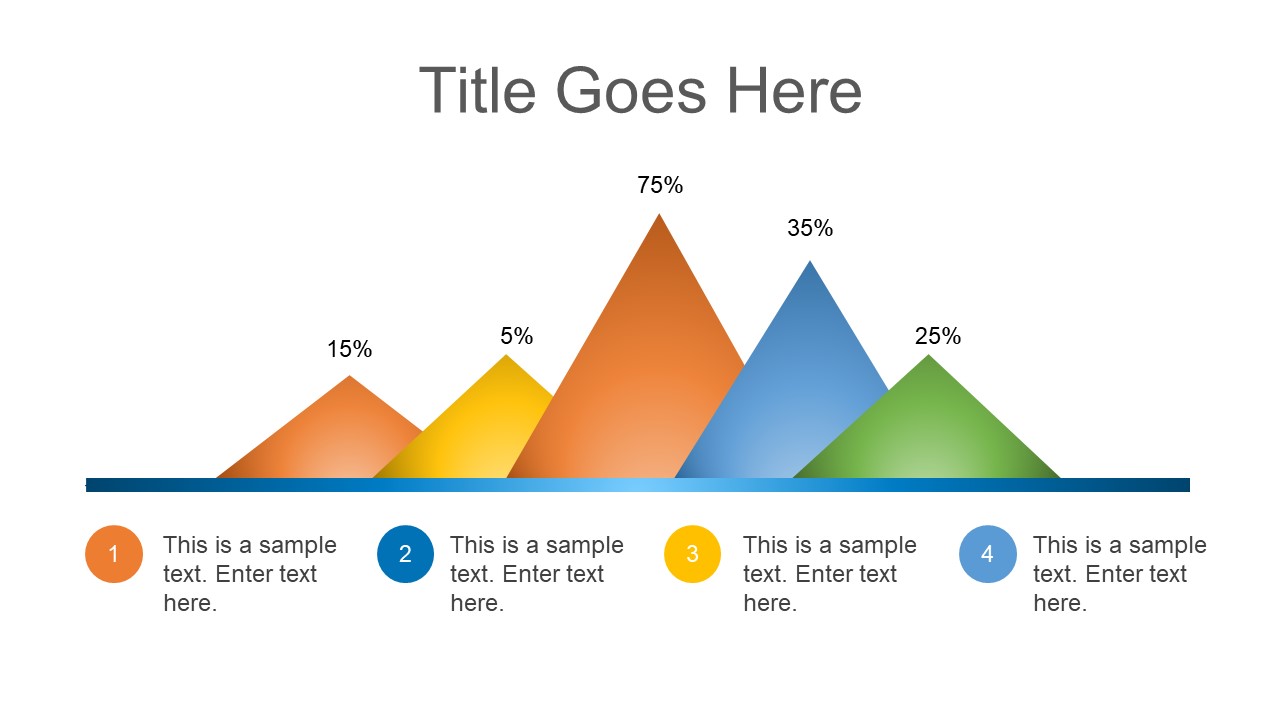


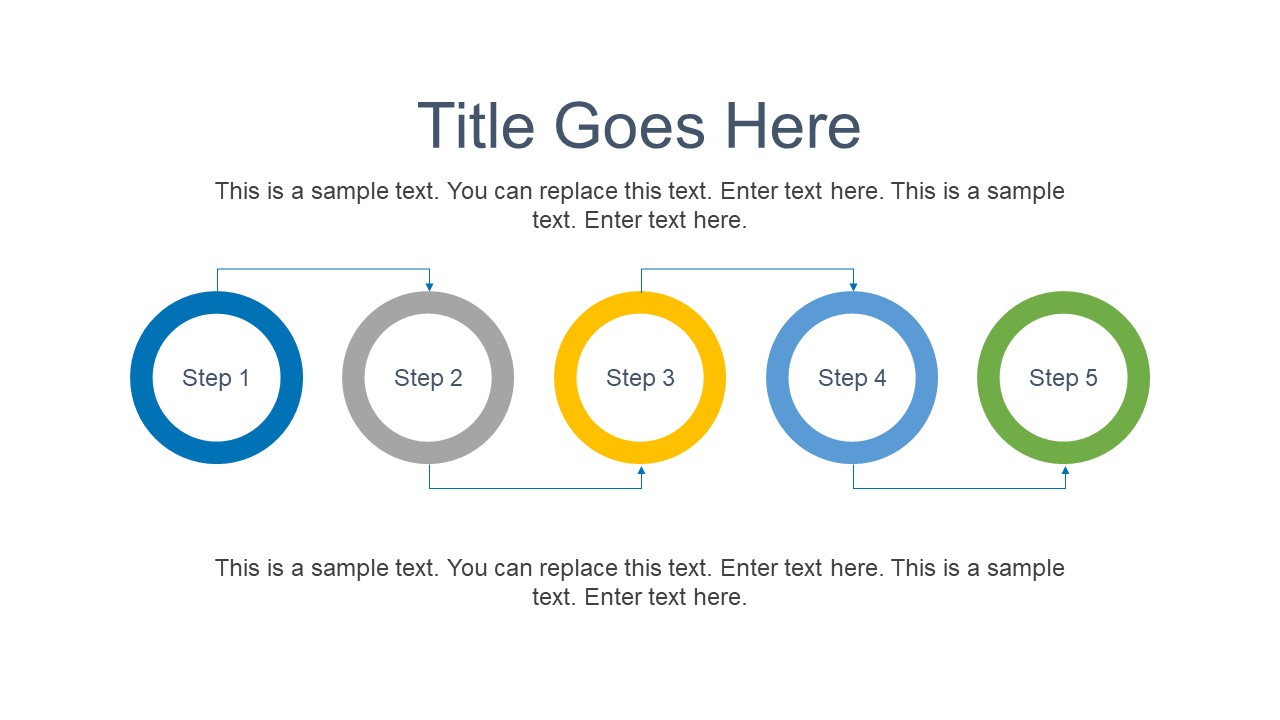


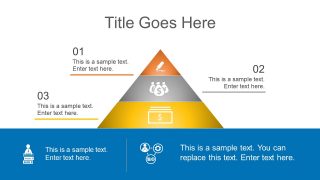

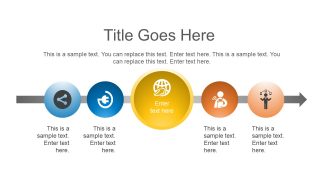

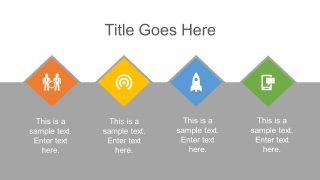


The Free Ultra Analysis Slide Template is a presentation layout to make business managers and professionals’ life easy. There are 23 slides featuring graphs, diagrams, and data-driven charts. This analysis template can help demonstrate sales proposals, market strategies, and several other management presentations. For example, describing the types of product, categories, or activities involved in a project’s process using 6 segments PowerPoint layout. Simply copy the relevant slides, insert text, and customize it according to original PowerPoint theme. Further, this ultra-analysis PowerPoint theme is ideal for data science and technology presentations. The visually appealing graphics and diagrams here can help users to deliver their data science concepts in no time. Like explaining data-mining, machine learning or simulation.
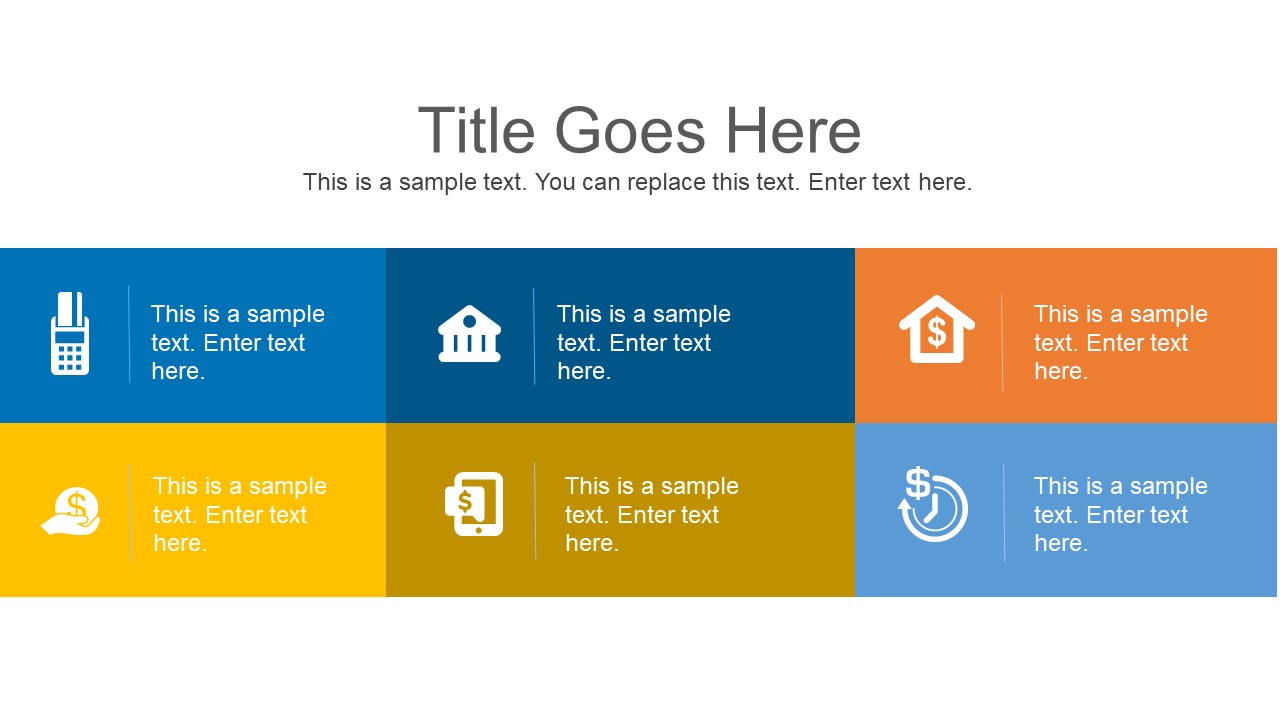
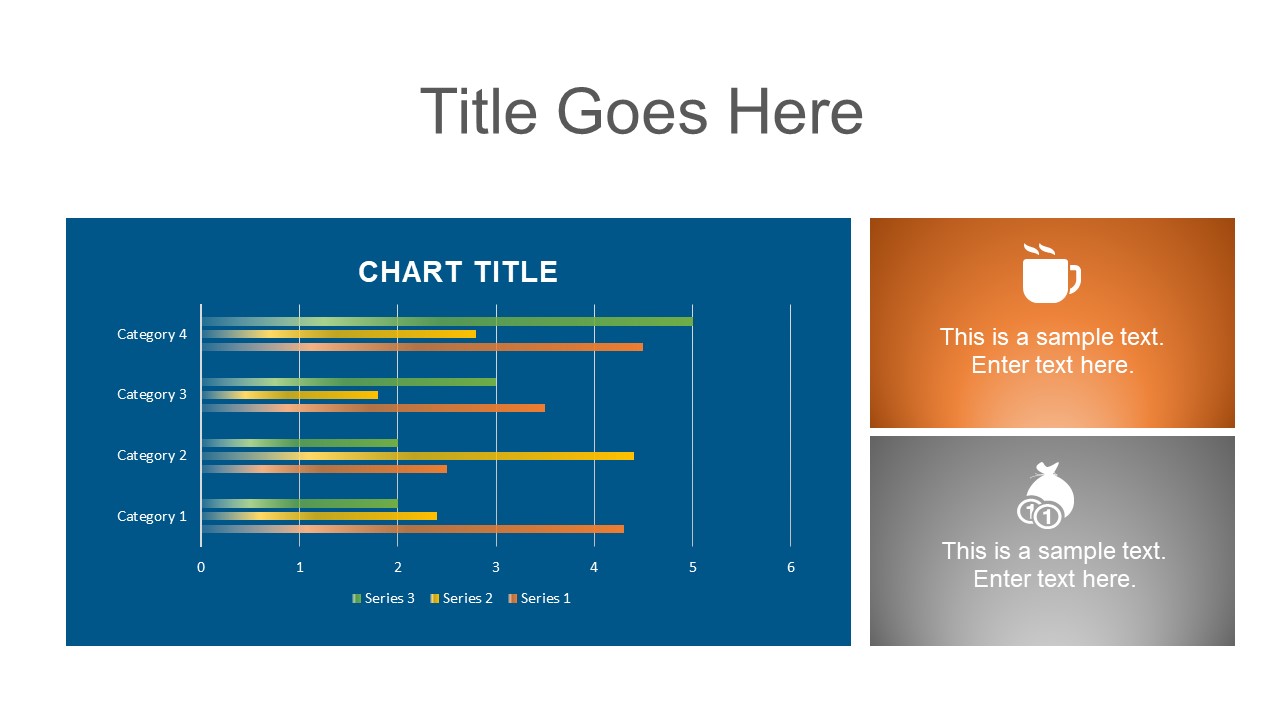
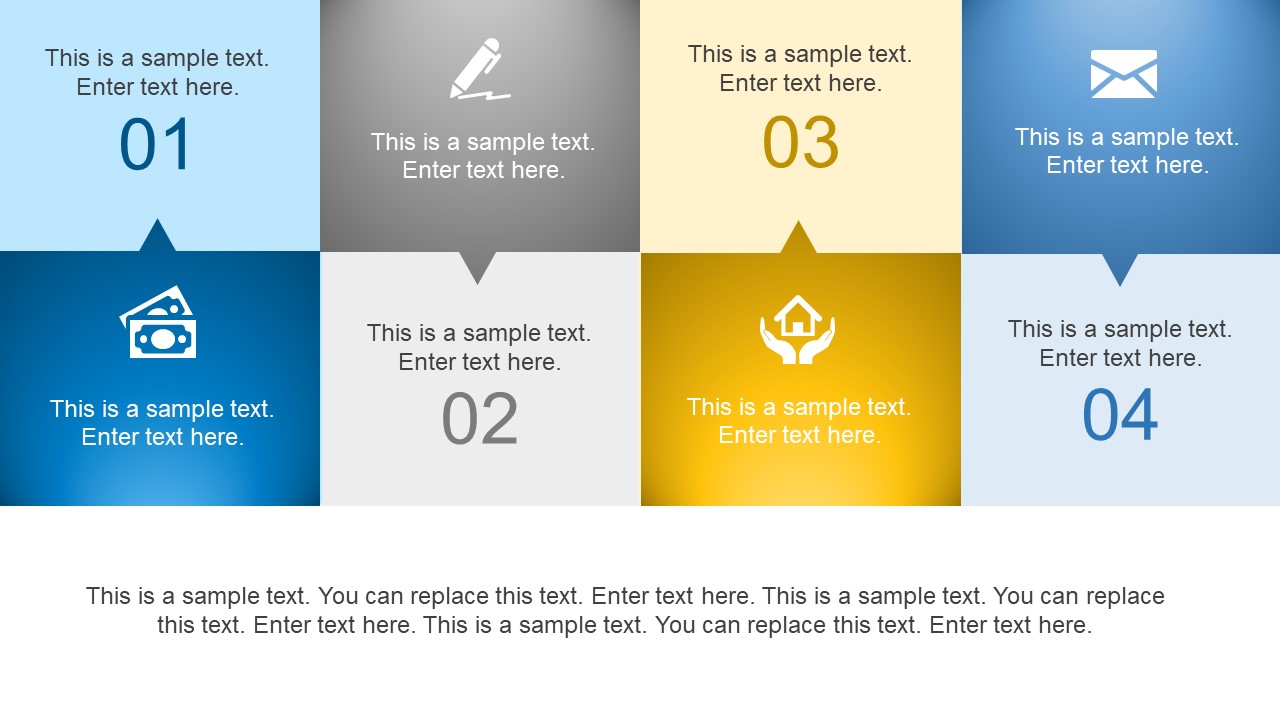
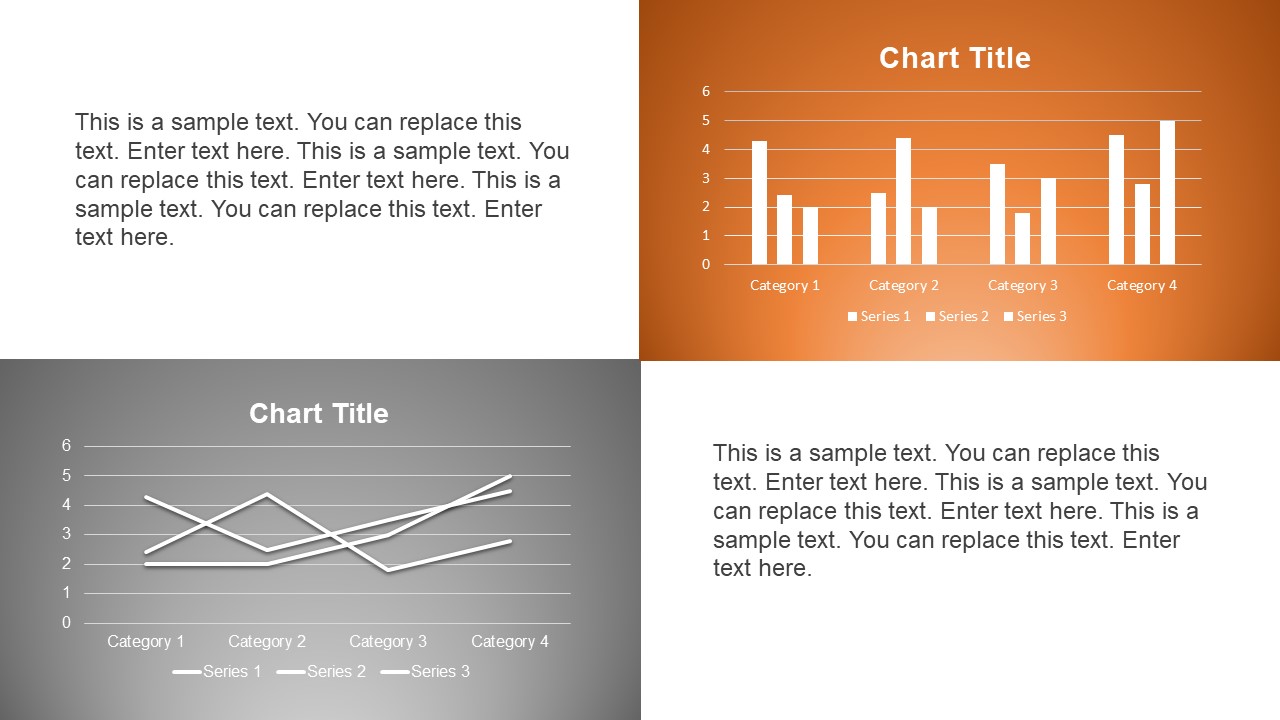
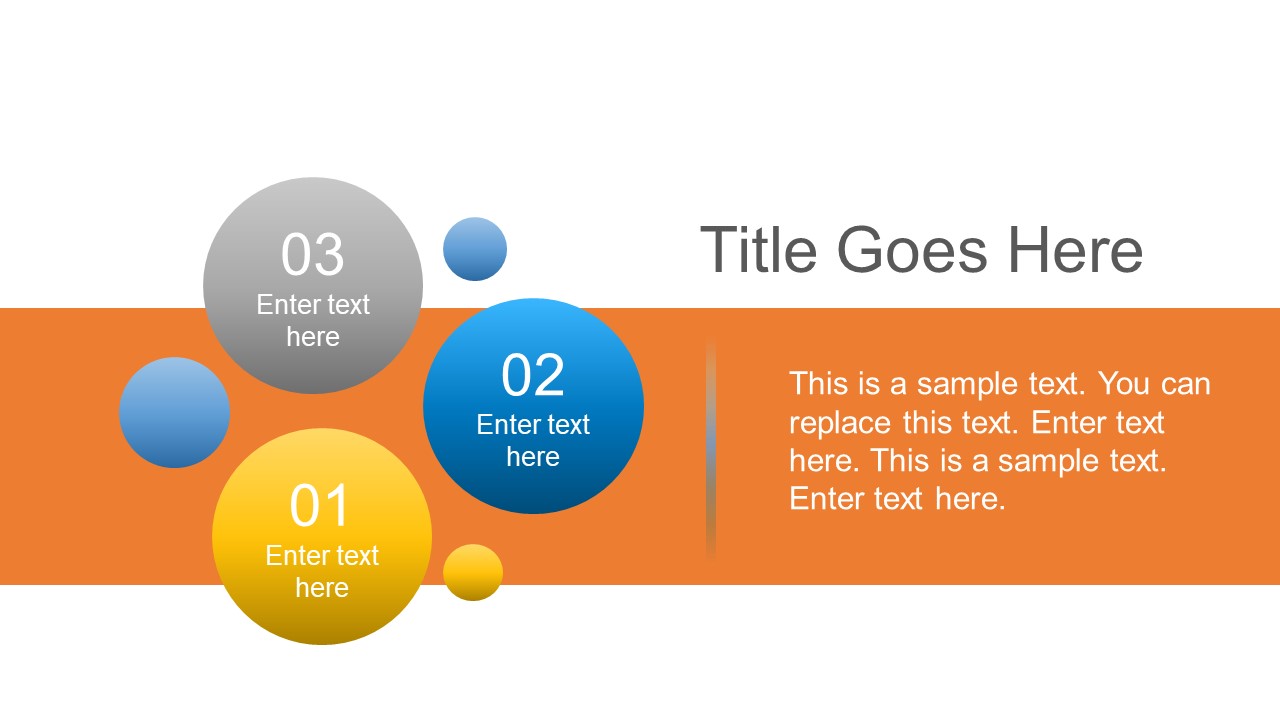
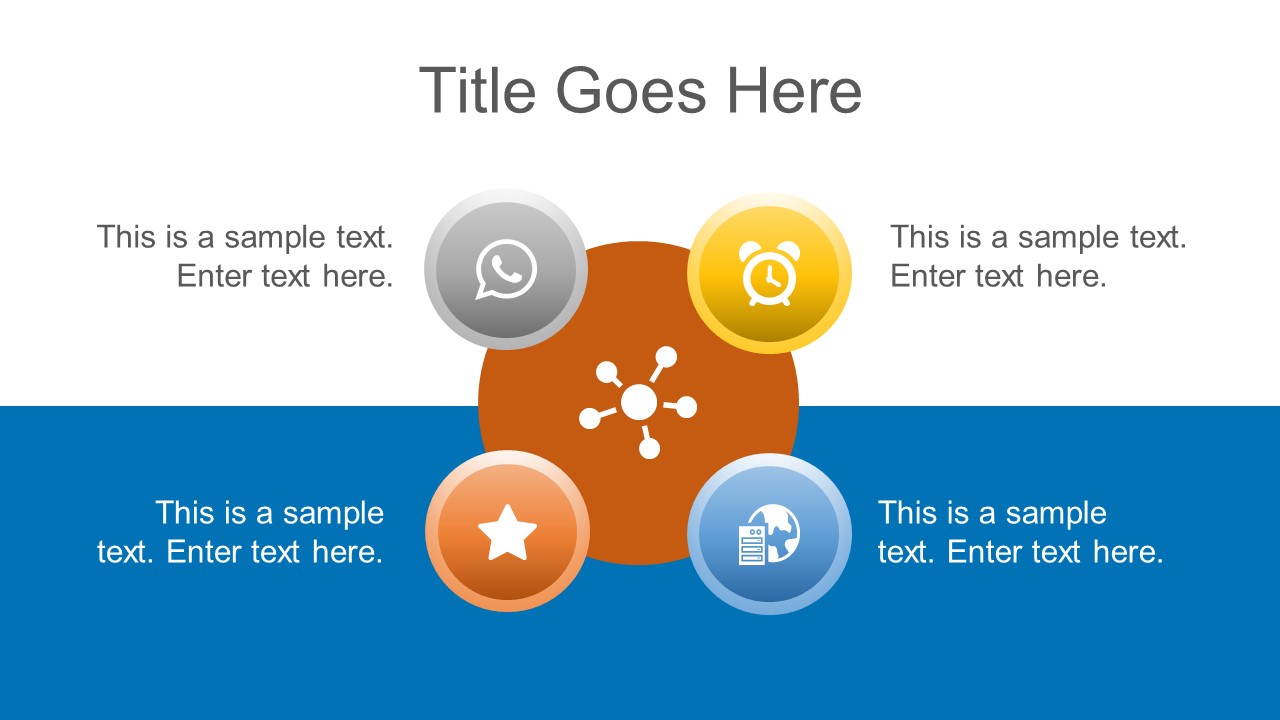
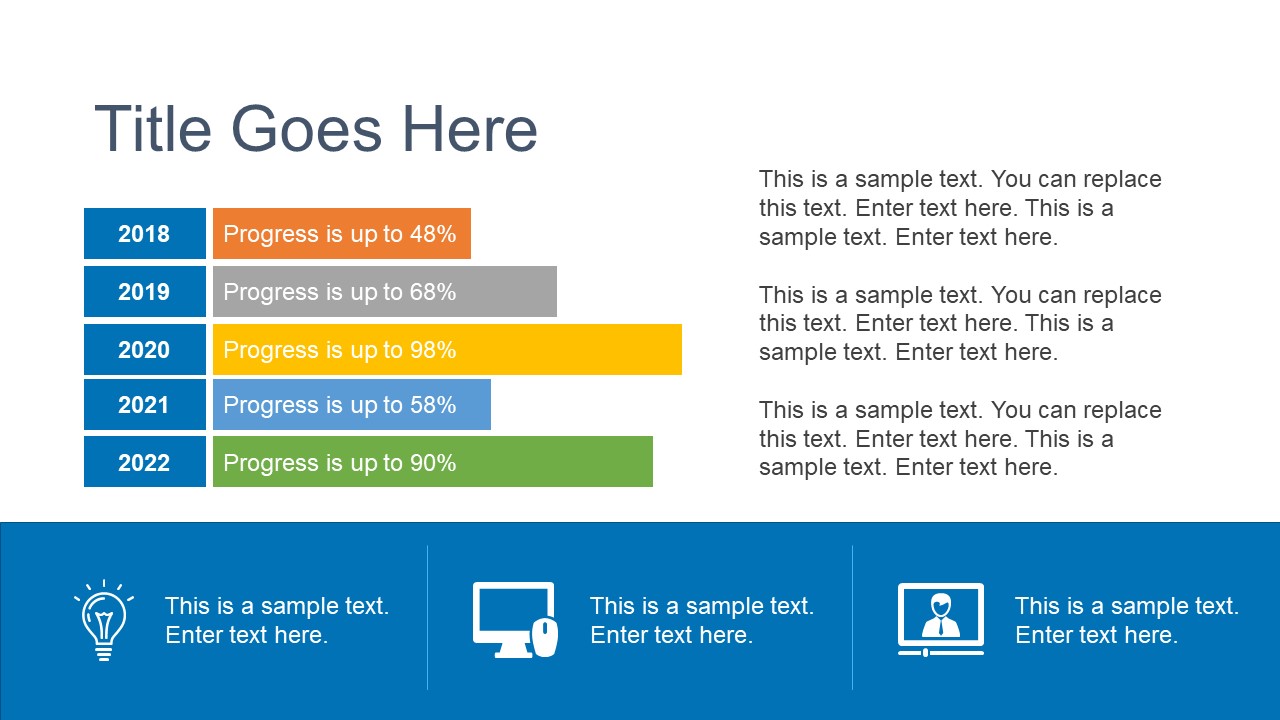
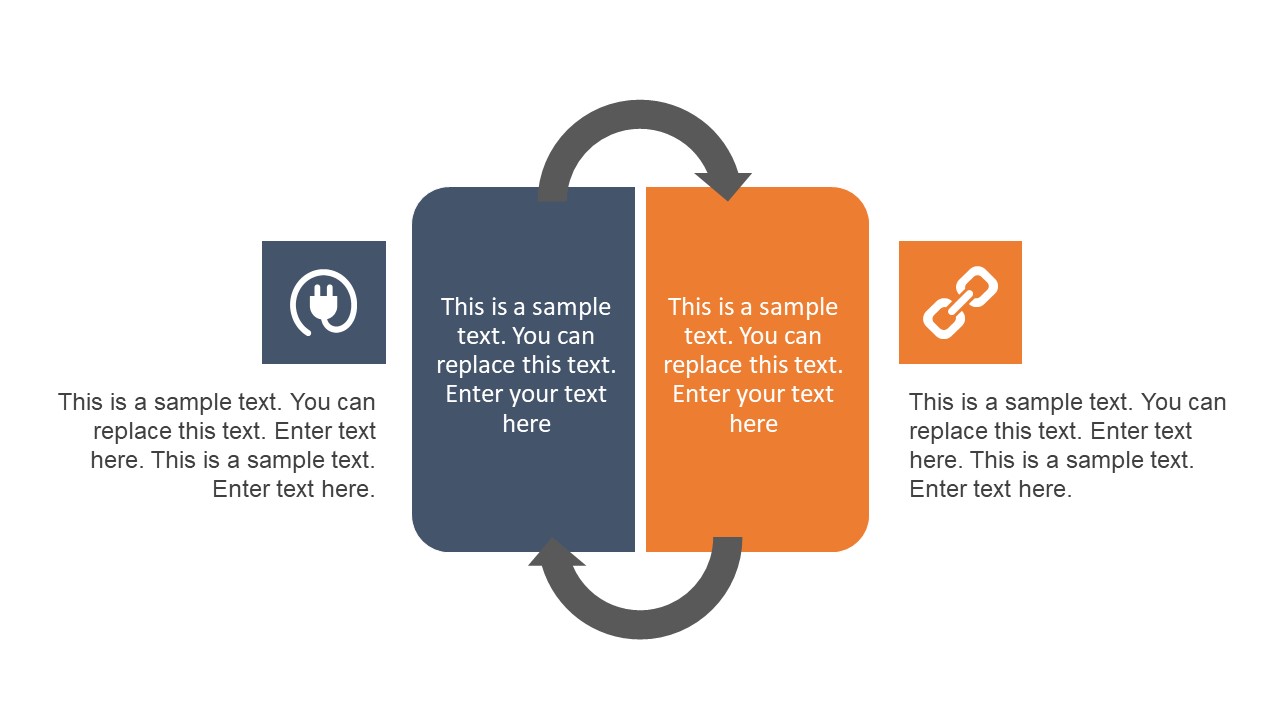
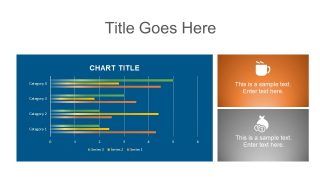
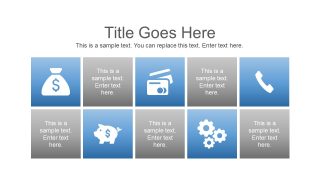
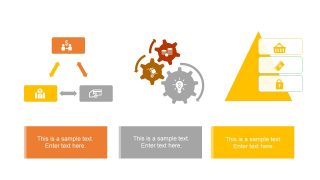
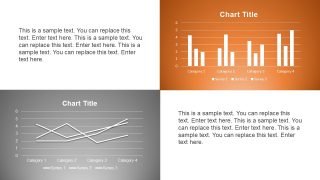
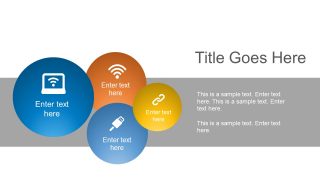
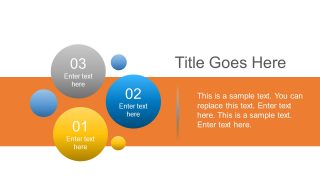
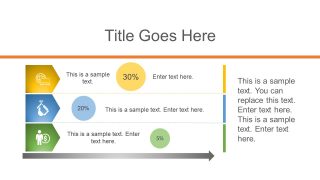
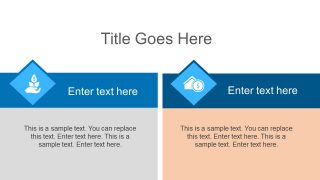
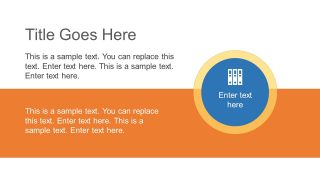
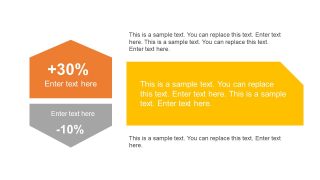
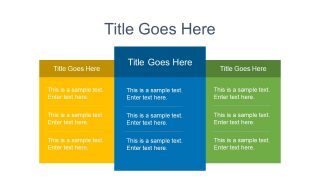
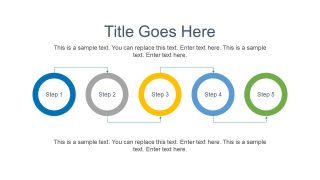
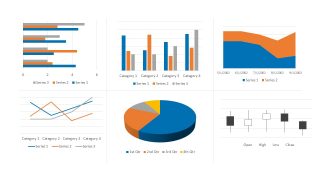
The Free Ultra Analysis Slide Template also provides a range of useful infographics for several corporate presentations. These include many infographic icons for finance, information technology, and work performance. A few icons illustrate monetary concepts using $ symbol but, users can replace it with their currency. Not only the icons, but these free slides also assist professionals to decorate their ultra-analysis and dashboard presentations. There are 6 slides with multiple segment layouts to discuss features, steps, or bullet points. Furthermore, 3 data-drive chart slides contain a collection of custom graphs including bars, area, pie, and trend analysis. While the remaining slides include diagrams and timeline templates to visually describe business terms.
The PowerPoint template can benefit any large or small business to present their complex data concepts. Such as KPIs dashboard, annual reports, timelines, revenue or growth. This ultra-analysis presentation is a perfect data visualization tool for any organization. Because it can display multiple charts of more than one performance metric in a single slide view. A visually appealing graphics and data charts will assist the audience to grasp difficult concept. For instance, using infographics and shapes relevant to the topic so viewers can create its mental image.
FEATURES
- 100% Editable PowerPoint Templates & Google Slides.
- Compatible with all major Microsoft PowerPoint versions, Keynote and Google Slides.
- Modern 16:9 Aspect Ratio.
- Scalable Vectorial PowerPoint Shapes and PowerPoint Icons.
- Instant Access and Download.
- New Templates every week.
Google Slides Preview
Our PowerPoint Templates are compatible with Google Slides. Take the most of every platform using the tool you like.

