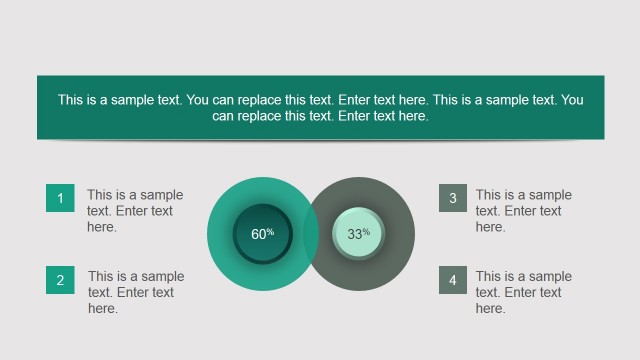
Slide 18 of 23 from Free Ultra Analysis Slide Template
Ultra Analysis Percentage PowerPoint
Percentage Comparison Analysis Slide
- Diagram
- Comparison Split
- Evaluation Slide
- 16:9
- 100% Editable
The +/- Percentage Comparison slide from the Free Ultra Analysis Slide Template offers a clear visual format for contrasting positive and negative data points. Ideal for business presentations, this slide template supports detailed financial analysis and project evaluations by using editable shapes and color-coded hexagons to highlight performance metrics effectively within a professional slide deck.
What’s on This Slide
The slide features two hexagonal shapes positioned at the top left and bottom left, with the upper shape displaying a positive percentage increase of +30% and the lower shape indicating a negative percentage decrease of -10%. Each shape contains a text placeholder aligned centrally for entering relevant data. To the right, a rectangular shape in orange contains a larger text placeholder for additional information. A smaller placeholder is located below it for further details. The overall layout emphasizes the contrasting percentages through color and shape placement.
How to Use It
This layout serves as a comparative analysis tool, effectively illustrating positive and negative changes in data. It fits well in presentations discussing performance metrics, financial results, or project evaluations. The structure allows for clear communication of contrasting figures, making it suitable for business reports or strategic discussions. It can be used in various contexts, such as quarterly reviews, marketing performance assessments, or operational efficiency evaluations.
Text Placeholders & Capacity
Keep your copy within these limits so it fits without resizing. Node body slots can hold roughly 15-20 words each.
| Placeholder | Count | Max characters (approx.) |
|---|---|---|
| Item heading | 2 | 15 |
| Item body | 2 | 100 |
| Body paragraph | 2 | 150 |
Slide Keywords
Download unlimited PowerPoint templates, charts and graphics for your presentations with our annual plan.
DOWNLOADReturn to Free Ultra Analysis Slide Template.