Slide 23 of 23 from Free Ultra Analysis Slide Template
Dashboard Slide Data Driven Chart
Comprehensive Data Visualization Slide
- Chart
- Dashboard Composite
- Data Findings Slide
- 16:9
- 100% Editable
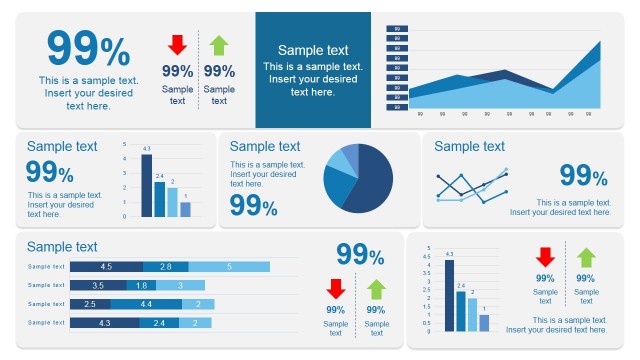
The Data Visualization Overview slide from the Free Ultra Analysis Slide Template offers a structured layout with multiple chart types ideal for business presentation templates focused on quarterly reviews and market analysis. This slide's editable shapes and vector icons facilitate clear data communication, making it suitable for corporate presentations and pitch deck templates that require concise visual summaries of complex metrics.
What’s on This Slide
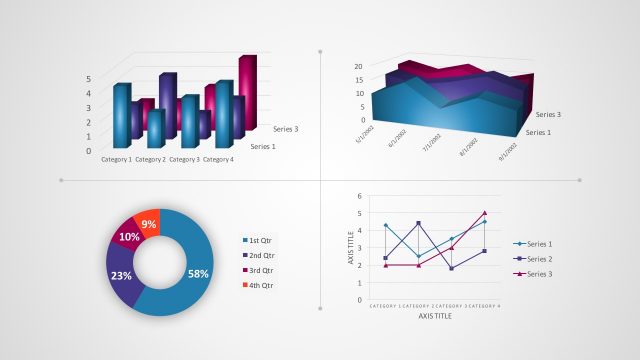
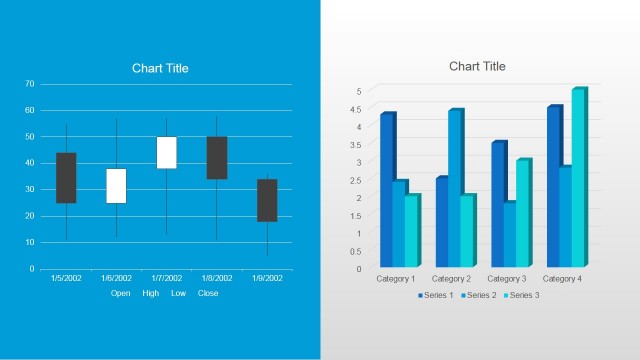
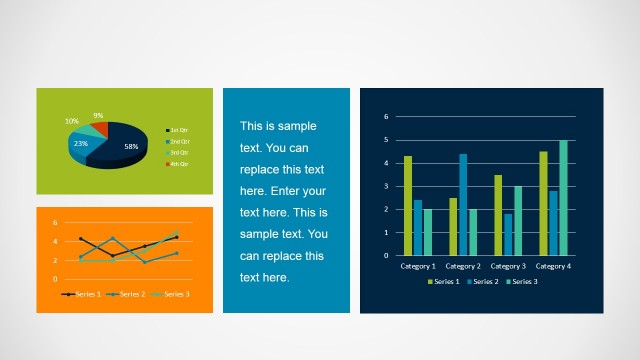
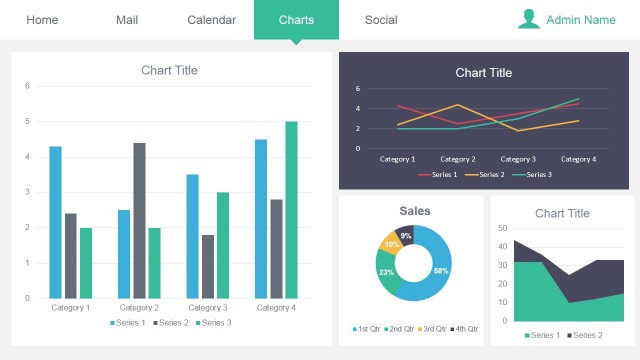
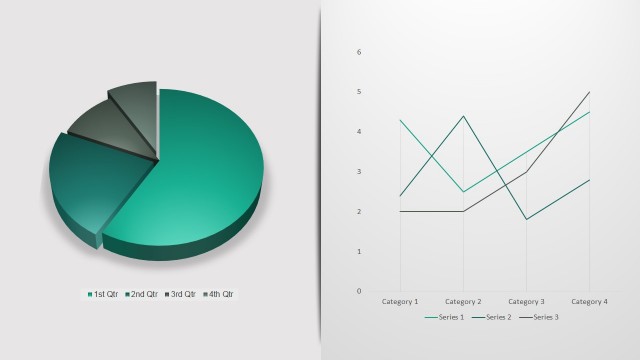
The layout features six distinct data visualizations arranged in a 2x3 grid. The top row includes a horizontal bar chart on the left, a vertical bar chart in the center, and a line chart on the right. The bottom row contains a pie chart on the left, a multi-line chart in the center, and a candlestick chart on the right. Each chart has labeled axes or legends, and the pie chart displays segments in different colors. Text placeholders exist for titles and legends, positioned above or beside the charts, maintaining a clear visual hierarchy.
How to Use It
This layout serves as a comprehensive overview of multiple data visualizations, suitable for presenting various metrics or trends in a business context. It fits well in a presentation sequence following detailed analysis slides or before strategic discussions. Ideal scenarios include quarterly performance reviews, market analysis reports, or data-driven decision-making sessions. The structure allows for quick comparisons across different data sets, enhancing audience understanding of complex information.
Text Placeholders & Capacity
Keep your copy within these limits so it fits without resizing. Chart titles and legends are tight, roughly 10-15 characters each.
| Placeholder | Count | Max characters (approx.) |
|---|---|---|
| Chart title | 6 | 20 |
| Axis label | 6 | 15 |
| Legend | 6 | 10 |
Slide Keywords
Download unlimited PowerPoint templates, charts and graphics for your presentations with our annual plan.
DOWNLOADReturn to Free Ultra Analysis Slide Template.