In the corporate world, many professionals excel at generating reports and financial plans, but we talk about a whole different thing regarding financial presentations. Much like report presentations, they are an entirely different discipline where overloading slides with information tends to be a common bad practice. Hence, acquiring good slide design habits from day one is important.
A financial presentation’s primary goal is to communicate a company’s financial health and performance clearly and compellingly. It goes beyond displaying numbers and charts; it requires a deep understanding of the data and the ability to weave it into a narrative that tells the story of the company’s financial journey and which is its next expected destination. In this article, you will learn how to effectively present financial results so financial professionals and stakeholders without financial education can make informed decisions based on your slides. Additionally, we will list a series of financial presentation templates to make this task easier, taking the design decisions off our hands to concentrate on content generation.
Table of Contents
- What is a Financial Presentation?
- What are the Elements of a Financial Presentation?
- How to Extract and Present Data from Financial Plans and Reports
- Presenting Financial Data in Visual Formats
- How Financial Presentation Templates Save Time
- Recommended Financial Presentation PPT Templates
- FAQs
- Final Words
What is a Financial Presentation?
A financial presentation is a strategic tool used within a corporate setting to convey important financial data to stakeholders. The primary purpose of these presentations is to inform decision-making processes, showcase company performance, and strategize future operations based on financial insights.
At its core, a financial presentation serves to bridge the gap between what’s understood as complex financial data and strategic business decisions. From a knowledge standpoint, it provides a framework to display financial achievements, highlight areas that need attention, and generate traction on future business decisions.
What are the Elements of a Financial Presentation?
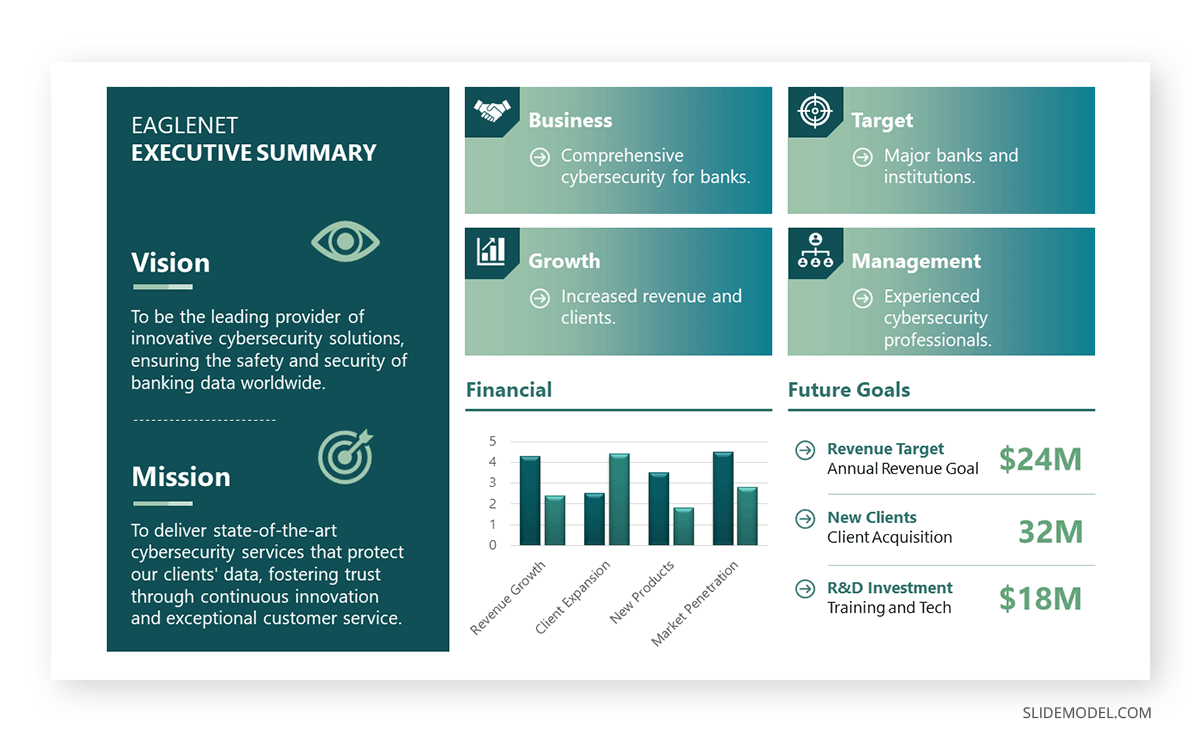
Introduction and Executive Summary
Every financial presentation should start with a clear introduction slide that outlines the objectives and what the audience can expect. This is followed by an executive summary, which offers a concise overview of the company’s financial status.
Check out our article on how to start a presentation for more ideas to break the ice at the initial stages of your financial presentation.
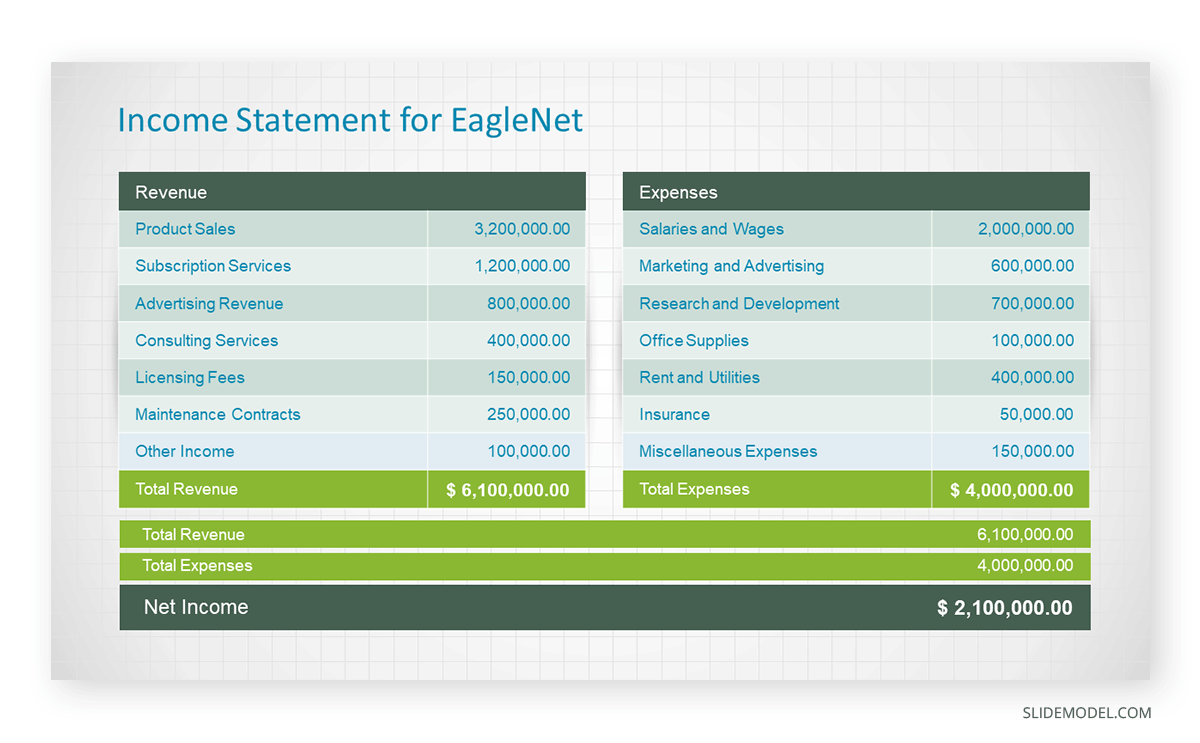
Financial Statements Overview
The financial statements to list are the balance sheet, income statement, and cash flow. Those three are critical; depending on the presentation’s objectives, we can add more if required. This overview is not about showing the tables but includes a brief explanation of each component, highlighting significant changes and trends that are required for the audience’s understanding.
Key Performance Indicators and Ratios
From previously defined KPIs, the presentation must list the observed changes, if the metrics meet the success criteria, and where the situation drifts from expected. Examples of KPIs are profitability, liquidity, efficiency, and leverage ratios.
If you prefer to work with the OKR approach, we invite you to check our guide on presenting objectives and key results.
Analysis of Financial Performance
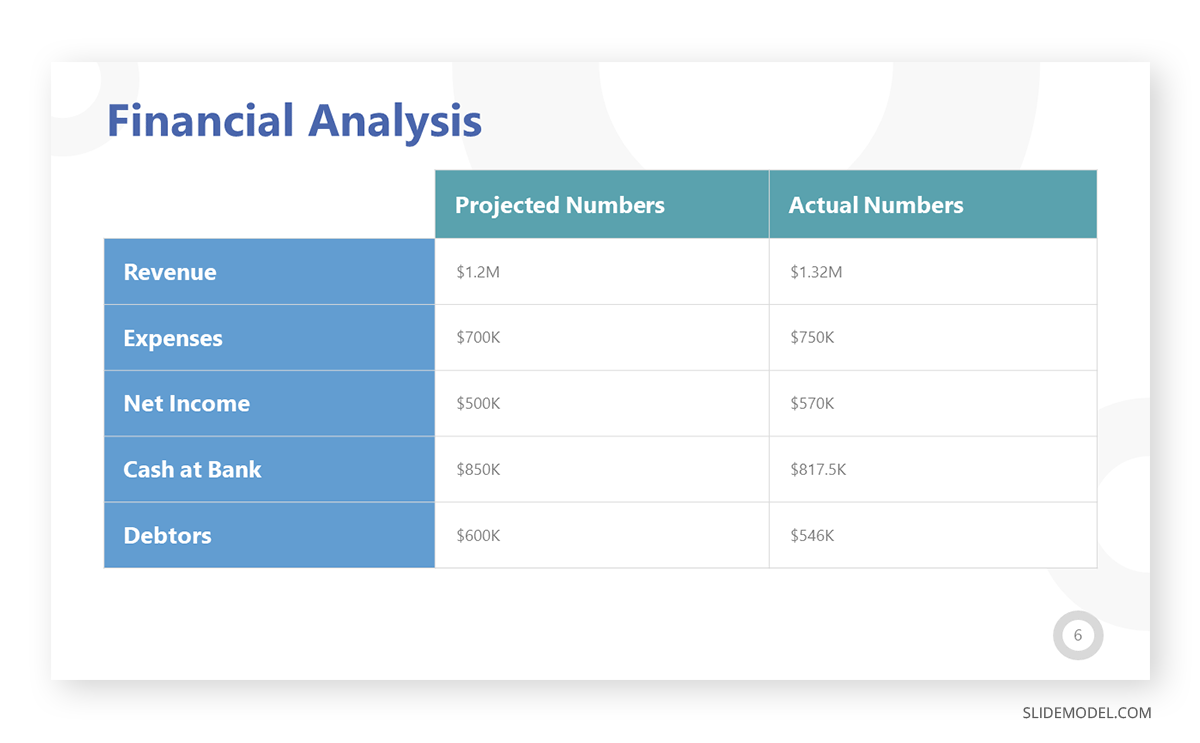
After introducing all the previous data, the presenter must now examine that data, explaining trends, identifying performance drivers in the financial plan, and examining the variances between projected and actual numbers. The core objective is to answer why the results occurred, what they mean for the business, and which corrective measures must be implemented—if required.
Forecasting
Financial projections are presented and discussed based on current market conditions, the current financial situation, and historical data. If the data set is large enough, revenue forecasts, expenditure forecasts, and cash flow forecasts are typically displayed on individual slides. The periods to project depend on whether we are talking about an annual financial forecast, quarterly, etc.
Strategic recommendations for these future scenarios should also be included, as they give decision-makers actionable insights.
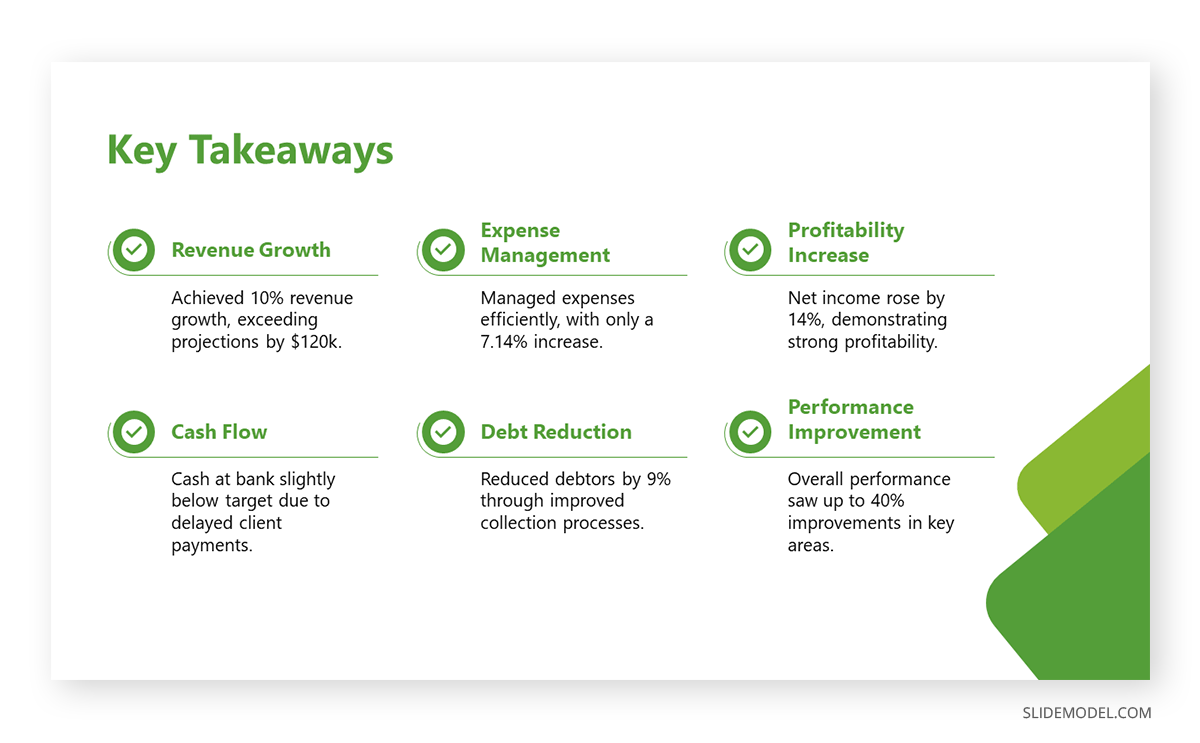
Conclusion and Call to Action
We can end the presentation with a summary of the key points discussed (especially if it was a lengthy presentation), the outlook for the company, and the core KPIs of financial health. The call to action to implement depends on the expected action to take out of the information: if making a decision, approving a strategy, or revisiting a budget, for example.
Appendices and supporting information can be delivered in handout for presentation format or include a hyperlink in the slide to access a cloud drive where all those documents can be seen.
How to Extract and Present Data from Financial Plans and Reports
Gathering Raw Information
The first step in preparing a financial presentation is to gather relevant data, which includes planned financials and the actual performance metrics. The planned financials refer to budget forecasts or financial targets, which are the blueprint against which actual data performance will be measured.
Data Analysis and KPIs
The data analysis is done in three stages. The first one is a Variance Analysis, which identifies the differences between planned and actual figures. We calculate the variance for each financial metric by subtracting the planned value from the actual value, and with this procedure, positive values indicate over-performance, whereas negative variances suggest under-performance.
Next comes the Trend Analysis, which helps to understand how certain metrics evolve over time. A positive trend is set if the revenue has increased consistently over the last few quarters.
The final analysis is the Ratio Analysis, in which some key ratios are:
- Profitability Ratios: Such as Gross Profit Margin, Net Profit Margin, and Return on Equity (ROE).
- Liquidity Ratios: Such as Current Ratio and Quick Ratio, which measure the company’s ability to meet short-term obligations.
- Efficiency Ratios: Such as Inventory Turnover and Receivables Turnover, which assess how efficiently the company is using its assets.
- Leverage Ratios: Such as Debt-to-Equity Ratio, which indicates the company’s reliance on debt financing.
To determine which KPIs to present, opt for this approach: define their relevance to the target audience and the objectives of the presentation. Provide context for each KPI and its importance, then select a visual aid (charts, graphs, etc.). Compare the KPIs against industry standards, previous periods, or budget targets.
Consolidate Financial Data
This stage involves a detailed examination of where the company has met the targets and where objectives weren’t achieved. The reasons for the variance must be exposed and clarified if they are internal or external. Then, we select the visual format to visualize such data in a way that helps our presentation’s narrative.
Presenting Financial Data in Visual Formats
Presenting financial data effectively requires the use of visual aids that clarify trends and comparisons. Column charts are ideal for depicting changes over time, allowing the audience to grasp growth patterns, cyclical trends, or inconsistencies quickly. Line charts can be used to denote trends more smoothly, particularly useful for presenting earnings trends or stock price movements over multiple periods.
Comparative Analysis
Business professionals can use formats like column charts listing the previous period or budget to discuss the variations with the actual data. This approach simplifies the process by juxtaposing different datasets rather than understanding two sets of graphs on separate slides.
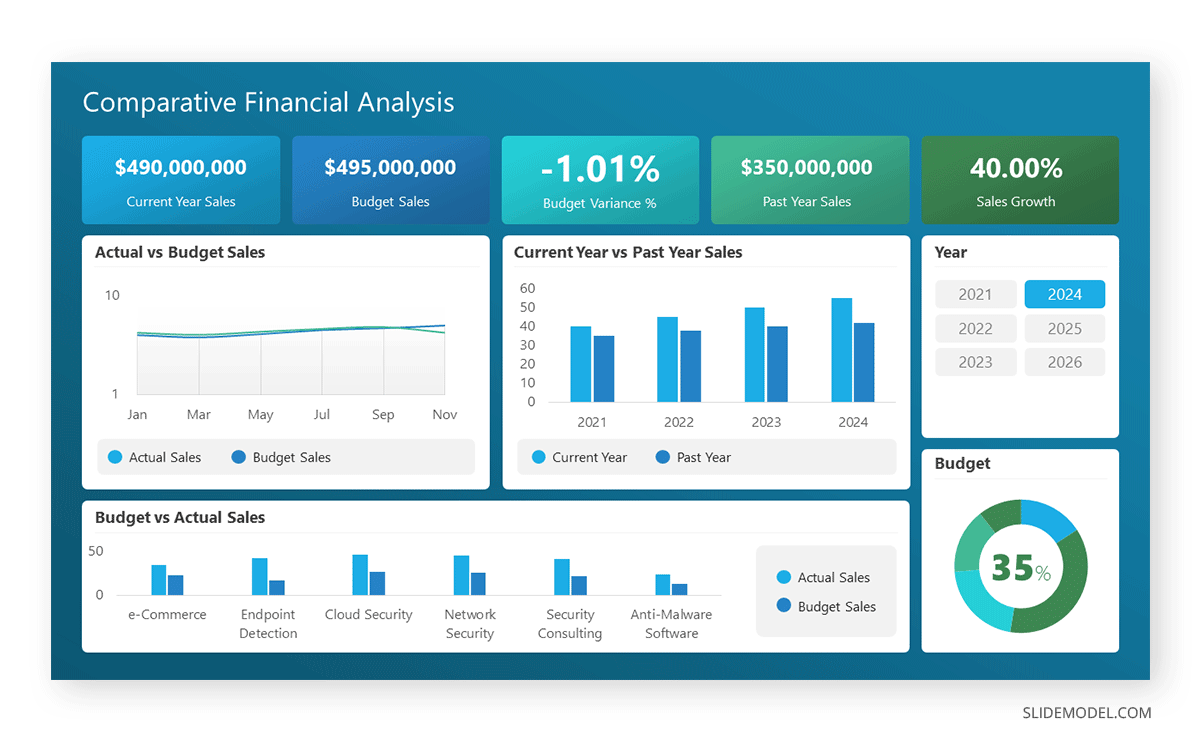
If you opt for charts, we can implement color coding in legends to distinguish between historical, budget, and actual data. This solution’s advantage is that the audience can visually appreciate growth rates or anomalies, which you can then explain in a second slide and apply the same color scheme for faster memory association.
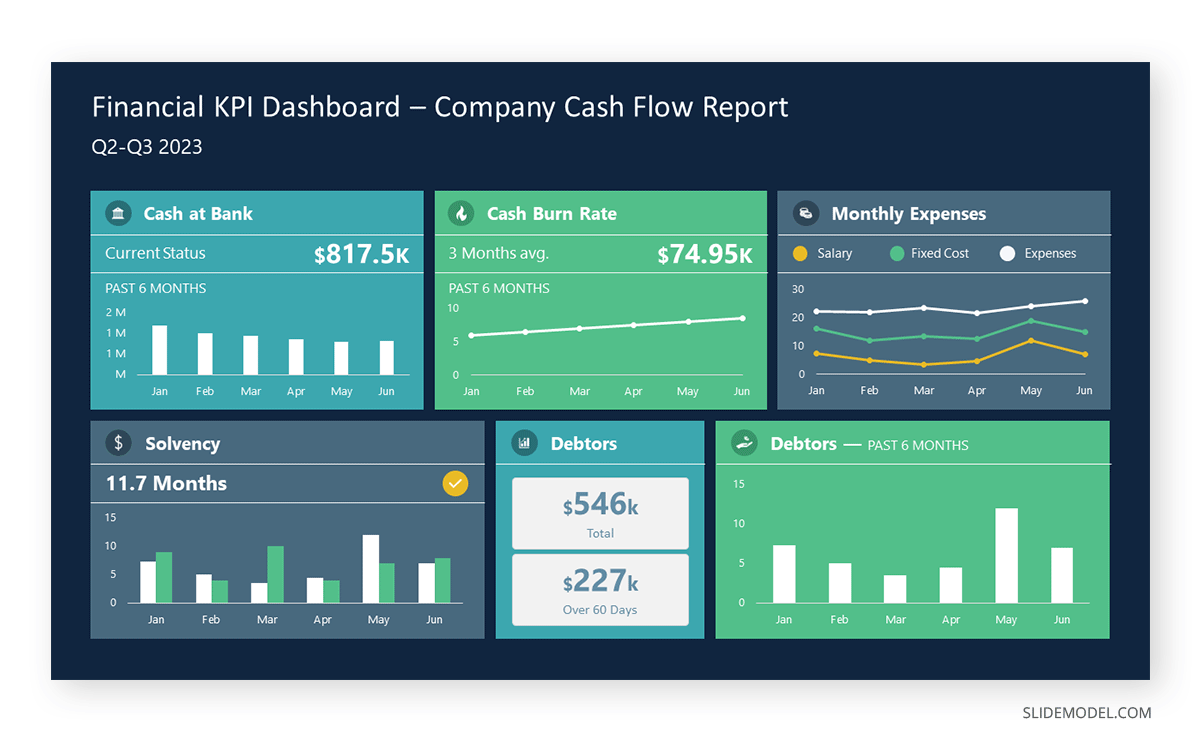
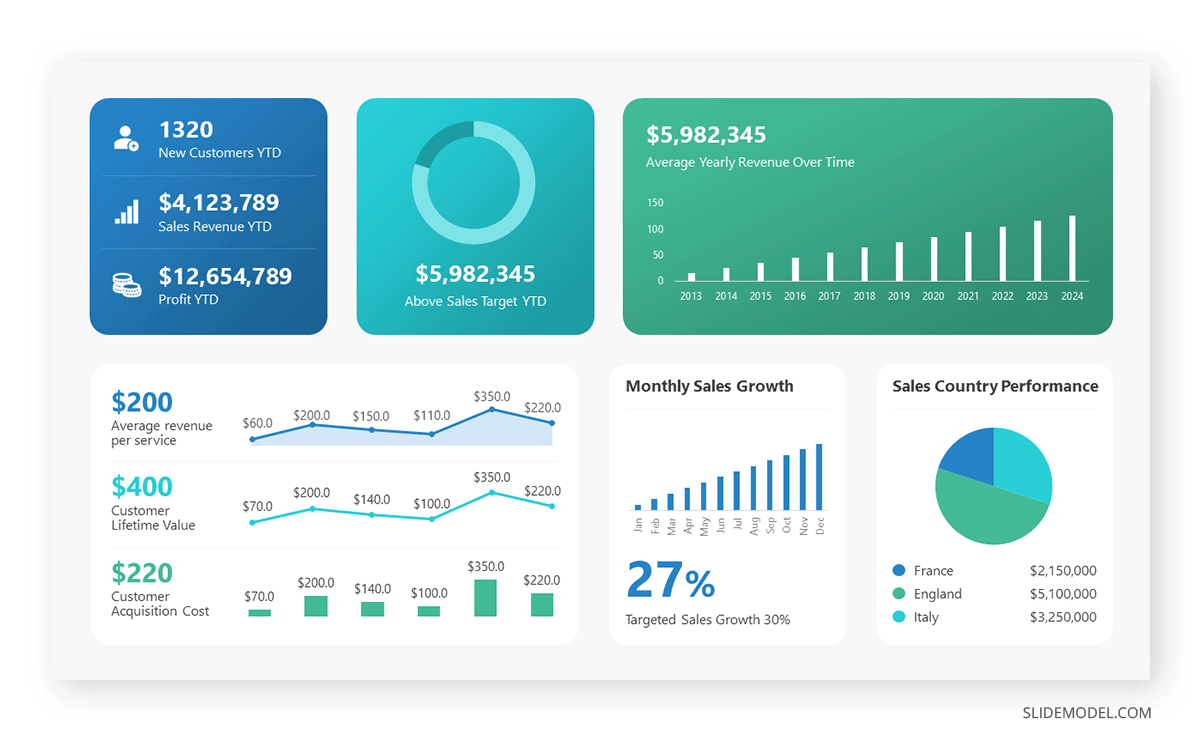
Dashboards
A preferred option for their versatile usage, dashboard templates for PowerPoint helps us consolidate various financial metrics into a single slide, with plenty of visual cues to maximize retention rate. The best part is that dashboards can be customized, or we can mix & match PPT templates to curate unique slide decks with all the tools required for our financial presentation.
How Financial Presentation Templates Save Time
Consistent Aesthetic and Efficiency
The need to dwell on design decisions is minimized when working with financial presentation templates. Those pre-made slide layouts are the byproduct of professional graphic designers and seasoned presenters, meaning they carry an appropriate white balance, color scheme, font pairing, etc. The areas in which you can include images are clear to access in the slide deck, leaving no room for polluted slides with excess content.
On an aesthetic side, since the templates are crafted by professional designers, the color palette is consistent across different slides, and the same applies to font size, font pairing, icon style, etc. All slides look like they belong to the same slide deck, even if you customize the templates with the native tools in your presentation software. The aesthetic remains cohesive, projecting an air of professionalism across your work.
Customization and Reusability
Working with PowerPoint templates for financial presentations has the advantage that we only need to pick our design once. We can continuously update a presentation template with newer data, save it as a new version of the presentation, and deliver it to our audience. This means updating text placeholder areas, graphs, charts, and images as required, a process that takes no longer than half an hour for extensive presentations.
Presenters can also adapt the presentation templates with their company’s branding color scheme, add logos, add more placeholder areas, and tweak any slide aspect as required. We offer plenty of guides on our blog for PowerPoint tutorials and Google Slides tutorials to come up with amazing results.
Recommended Financial Presentation PPT Templates
This section lists our selected financial presentation templates for PowerPoint and Google Slides, which can make your work much easier.
1. Expense Report for Financial Presentations PowerPoint Template
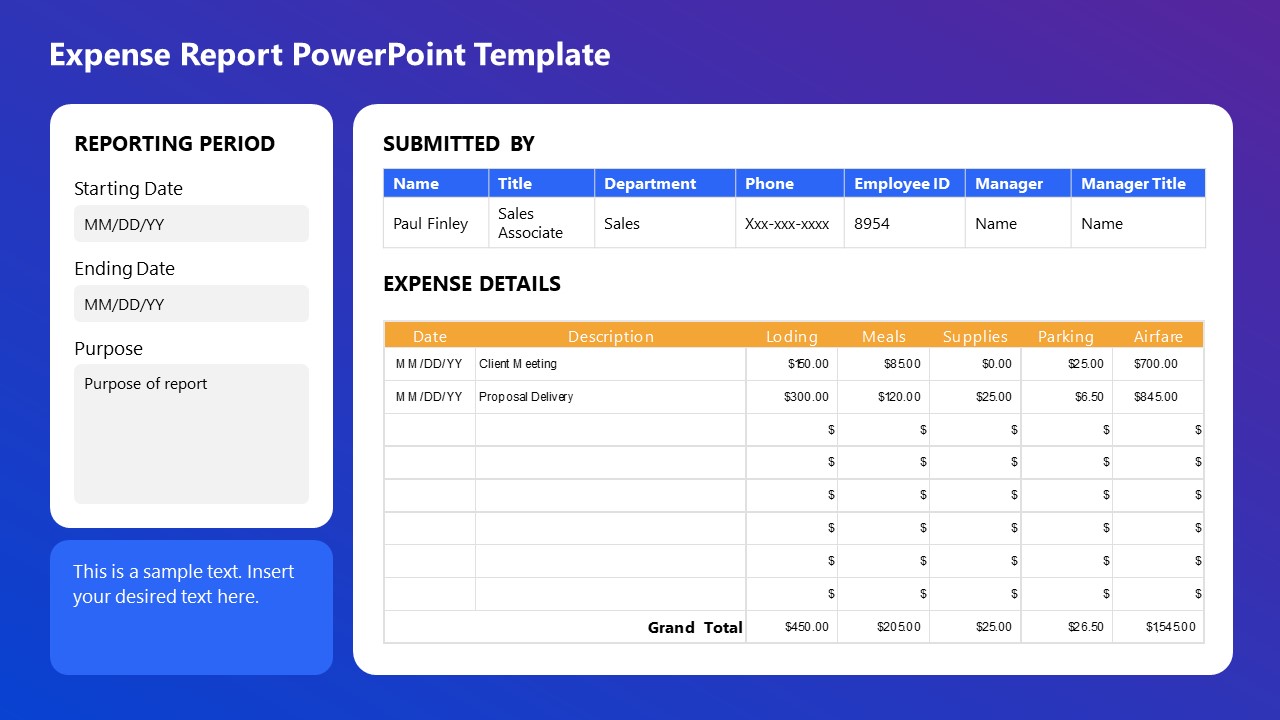
Easily track and report expenses with a clean, professional layout. Ideal for clear, concise communication with stakeholders. Save time and ensure accuracy in your reporting. Perfect for sales, finance, and management teams.
2. Performance Review Financial Results PPT Template
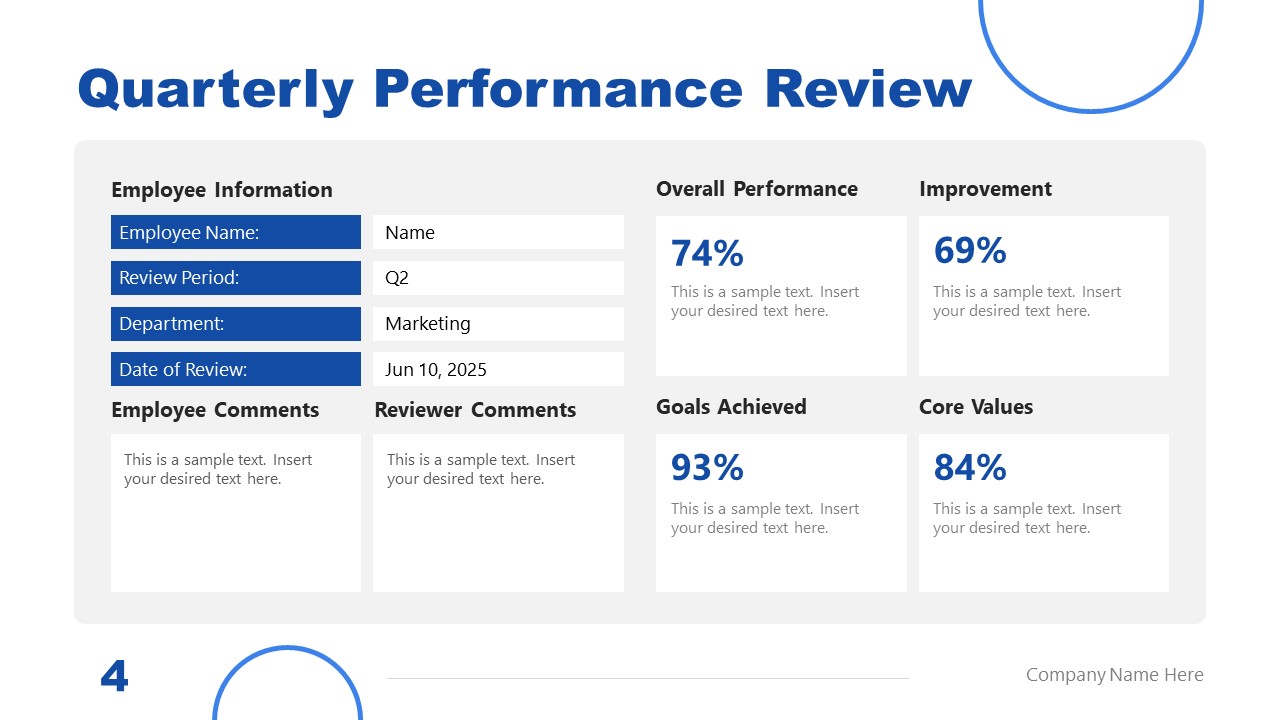
A slide deck containing all the tools required for the presentation of financial information. Annual performance review, quarterly performance review, strategic slides, and more. This template simplifies the evaluation process with a structured, easy-to-use format. It clearly presents employee information, performance metrics, and goals achieved.
3. Annual Report Finance Presentation Slide Deck

A compendium of tools from timelines, corporate governance, charts, bar charts, and plenty more options if you are wondering how to present financials. 23 slides to deliver transparency into any financial meeting. Check them out!
4. Finance & Investment PowerPoint Template

If you are browsing for an attractive PowerPoint template to engage potential investors, this is the slide deck to use in your upcoming financial presentation. 25 slides containing a broad range of visual cues, graphics, chart, tables, and anything else you can imagine a financial presentation might require.
5. Financial Savings Infographic PPT Template

This is the slide deck to check whenever a financial presentation requires infographics to break complex concepts into easy-to-recall cues. It contains five infographic slides, a detailed circular wheel chart with bar chart and donut chart companion graphics, and suitable icons to express any kind of situation with a deep level of detail.
FAQs
How many slides should a financial presentation have?
A financial presentation should typically have around 15-20 slides, depending on the complexity and depth of the information. Ensure that each slide serves a clear purpose and contributes to the overall narrative.
How can I make my financial presentation engaging?
Use clear and concise language, visual aids, and storytelling techniques to make your presentation engaging. Focus on the narrative behind the numbers, explaining the implications and strategic recommendations.
What common mistakes should I avoid in financial presentations?
Avoid cluttering slides with too much information, using overly complex jargon, neglecting to explain variances, and failing to align your presentation with the audience’s interests and knowledge level.
How often should financial presentations be updated?
Update financial presentations regularly, ideally every quarter, to reflect the most recent financial data and performance. This ensures stakeholders have access to current and relevant information.
What is the role of storytelling in financial presentations?
Storytelling helps connect the data with the audience by providing context and narrative. It makes the presentation more engaging and highlights the significance of the financial information.
How do I handle sensitive financial information in presentations?
Reinforce confidentiality by only sharing necessary information and using discretion when discussing sensitive topics. If required, anonymize data or use aggregated figures to protect specific details.
What are some advanced techniques for financial presentations?
Incorporate interactive dashboards, use scenario analysis to show potential outcomes, and apply predictive analytics to forecast future performance. Advanced visualizations like heat maps or waterfall charts can add depth to your presentation.
Final Words
Enhancing your financial presentation skills is not just about mastering the use of tools and techniques; it’s about effectively interpreting and communicating financial data to influence business decisions. With this tutorial’s tools and presentation structure, we are confident you can transform your financial presentations into strong strategic business guidance.