
No matter how good the earning of a business is today, you can never guarantee that it will still be as good tomorrow. After all, harvests vary from season to season, and an economic downturn can quickly cripple a business – unless it’s ready with a solid financial plan.
Financial planning considers the negative economic factors that could contribute to the fall of a business. It can provide insights for businesses to overcome economic challenges and thrive even during the driest season.
Still, creating a business financial plan is intimidating for many business professionals. What components to include, what metrics to track, and many other questions may arise. Let’s explore the nitty-gritty of preparing a financial plan and delivering a stellar financial planning presentation to stakeholders.
Table of Contents
- What is Financial Planning?
- Why Is Business Financial Planning Important?
- What to Include in a Financial Plan
- Presenting Financial Planning Results in Stakeholders Meetings
- Conclusion
What Is Financial Planning?
The Certified Financial Planner Board of Standards defines financial planning as “looking at a client’s entire financial picture and advising them on how to achieve their short- and long-term financial goals.”
It involves considering various financial components to help individuals and families achieve their aspirations – education, retirement, or building a safety net for emergencies.
Financial planning becomes even more crucial for businesses. As individuals have financial goals, businesses have objectives and financial resources to be carefully managed and aligned. This ongoing process is an integral facet of a business plan, delving into the cost structure of an enterprise, encompassing its revenue streams, expenditure, and cash flow. It also considers action plans to achieve objectives while considering potential risks and uncertainties.
Why Is Business Financial Planning Important?
Businesses of any size will benefit from financial planning. It’s a critical asset when seeking investment or financing from different partners. Investors require transparency and assurance that their investments will be used wisely and that you have a clear strategy for providing investment returns or paying your debts. A thorough financial plan makes you more appealing to potential funding sources, increasing the likelihood of securing the needed capital.
More importantly, you compile a financial plan for your good. As a business owner, it provides you with a roadmap to set your sights on long-term growth and realistic strategic goals. This approach ensures that you keep growing steadily while dealing with day-to-day operations.
As you set your sights on your long-term vision, it also allows you to allocate your funds in a way that will help you achieve your financial goals. This involves prioritizing investments that maximize efficiency and returns.
As business author Linda Pinson explains, a business plan should tell you “whether the business will be viable or you are wasting your time and/or money.”
What to Include in a Financial Plan
1. Revenue Forecast
A revenue forecast outlines a business’s anticipated income within a specific timeframe – typically monthly, quarterly, or annually. You may use your past sales reports to identify variables like market trends and seasonality and make reasonable assumptions about future sales.
If you own a startup business, you may invest more time and effort in conducting thorough market research to develop a sound revenue forecast. Understanding your customer segment, the stages of your sales funnel, and comparable industry data becomes crucial for estimating potential sales without historical data.
One way of calculating the potential revenue for your company is to use the bottom-up approach, which multiplies the number of likely sales by per unit price. With this knowledge, you become informed as you plan your marketing initiatives and growth strategies.
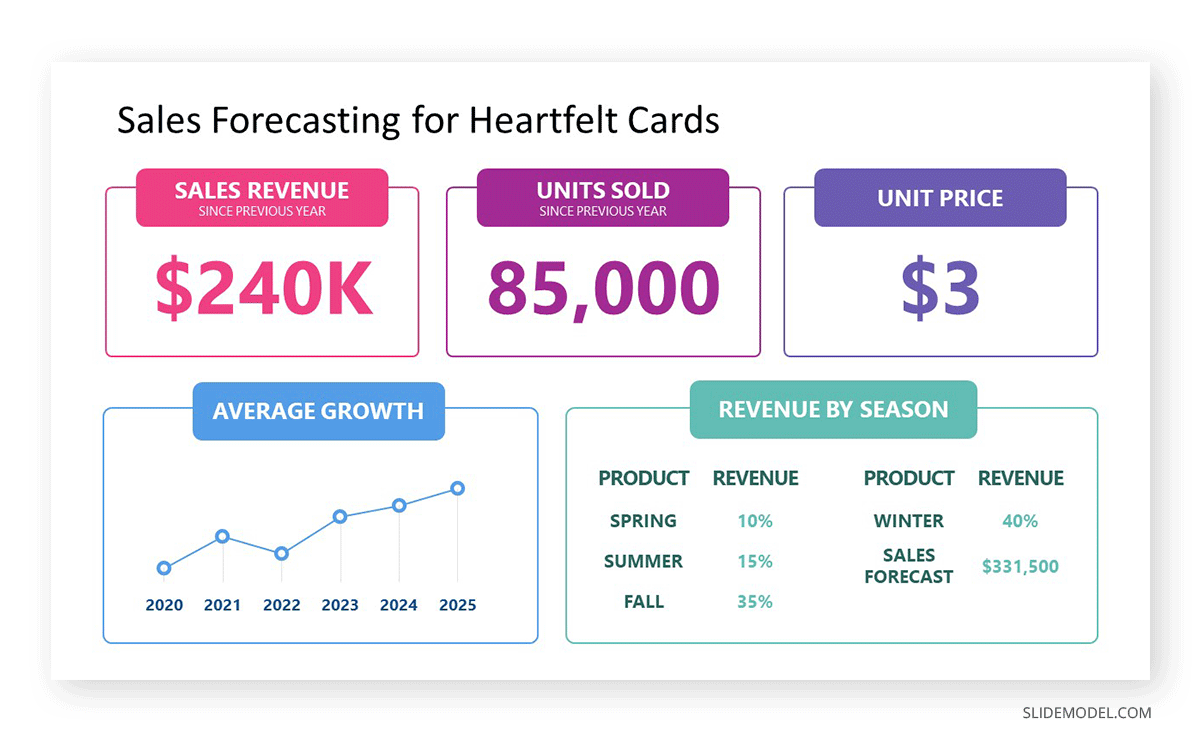
For example, a custom greeting card maker called Heartfelt Cards discovered that their sales revenue has been growing steadily since inception by a 30% rate on average beginning in 2020. Since there is an upward trend, they can apply the same growth rate of 30% to project the units sold for the upcoming year.
Projected Units Sold = Previous Year Units Sold * (1 + Growth Rate)
Projected Units Sold = 85,000 * (1 + 0.30) = 110,500
Or
Projected Revenue = Projected Units Sold * Unit Price
Projected Revenue = 110,500 * $3 = $331,500
Understanding how their revenue is distributed throughout the year can also help Heartfelt Cards optimize their operations, marketing plan, and resource allocation to take advantage of seasonal trends. For example, they can offer special deals or discounts to attract more customers during spring and summer when their sales are at the lowest.
2. Expense Outlay
This part of the financial plan covers the costs you incur or will incur in running your business in a set period. Tracking them helps you control your spending and make informed business decisions, like setting reasonable prices and sales volume, for profitability.
Expenses can be categorized into two broad types: fixed and variable. Fixed expenses are those that stay constant with the change in production. This may include machinery, rent, utilities, licensing fees, legal, etc. Expenses can also be categorized as variables or fluctuate proportionally with the production scale. Costs of raw materials, supplies, delivery, commissions, etc., are all considered variable expenses. Salaries may also be considered a variable input if it’s piece-rate labor.
Similar to revenue, expenses should be analyzed based on historical data. It should consider changes in your business model, like growth and inflation.
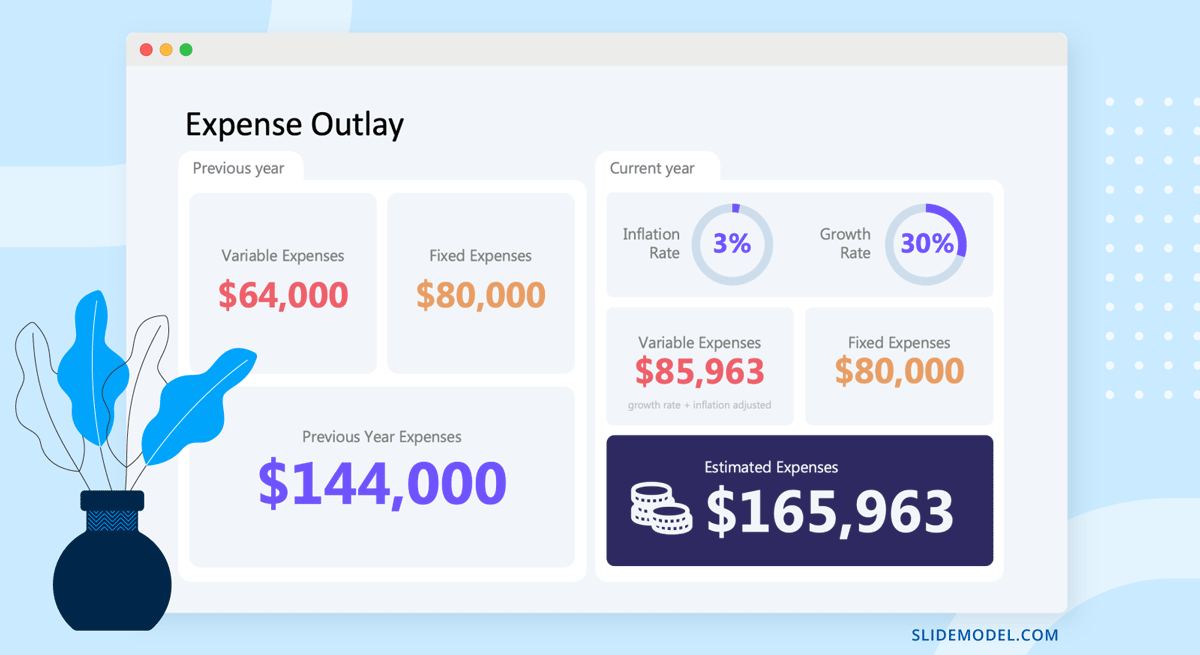
In this example, the variable expenses of Heartfelt Cards from the previous year were adjusted according to its growth rate and market inflation. Their fixed cost will remain unchanged if they do not purchase additional equipment or other assets. Combining the two will provide a forecast for Heartfelt Cards’ expenses.
3. Income Statement
You’re ready to construct an income statement with your projected revenue forecast and anticipated expenses. This essential financial statement provides a comprehensive view of your business’s profitability or loss during a reporting period; hence, it’s also called a profit and loss (P&L) statement. Within this statement, you factor in your company’s total income or revenue, subtracted by the costs associated with producing and marketing your product or service.
Income statements present a wealth of information for the company management and investors. This document can be a basis for business owners’ strategies to increase their profitability – whether increasing their revenues or cutting down on their costs. For investors, the income statement can clearly indicate the company’s financial health and ability to pay off its debts.
What should an income statement include? It should typically list the following:
- Revenue – gross sale of the company
- Cost of Goods – the amount that it costs to produce your product (e.g., raw materials, overhead, workforce)
- Operating Expenses – indirect cost generated in carrying out business activities (e.g., advertising, sales commission, tax, depreciation)
- Net Profit – the amount after deducting allowable business expenses
You may also include in your income statement non-operating income and expenses. Non-operating income is the amount you gain from a business activity unrelated to your core business operations, like selling an asset. On the other hand, non-operating expenses are the unexpected costs your business incurs, such as the expenses arising from a lawsuit.
Here’s what an income statement may look like in a presentation.
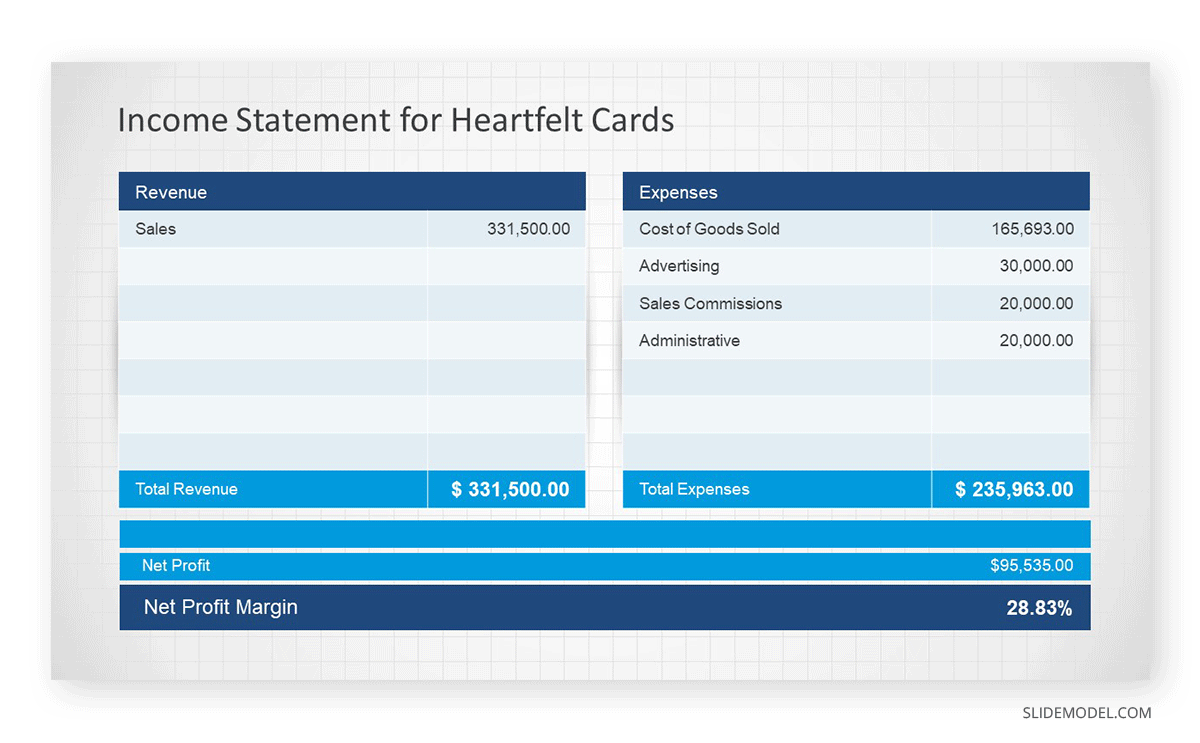
As you can see in the example, the Net Profit Margin (28.83%) indicates healthy profitability for Heartfelt Cards, with a significant portion of its revenue translating into profit.
4. Balance Sheet
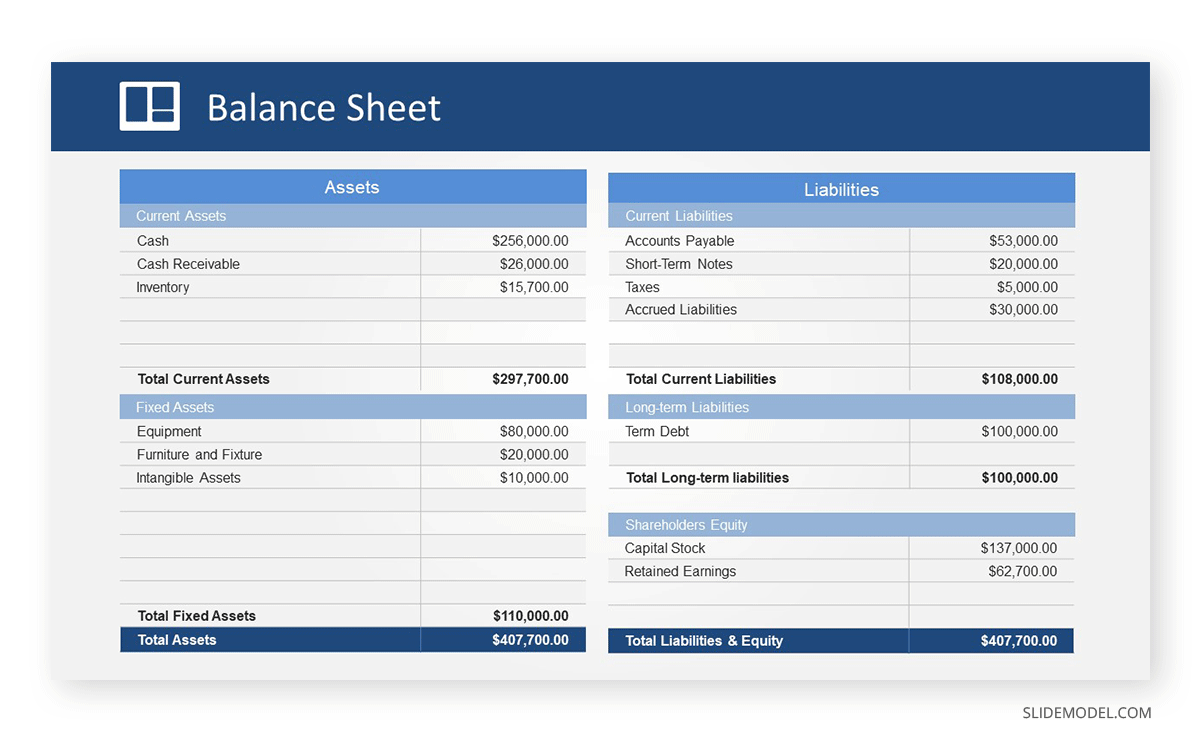
Sometimes, creditors want to see where your company stands financially rather than peering into the future. Specifically, they want to see your balance sheet, a type of financial statement detailing your assets, liabilities, and equities. Seeing that your assets are greater than your liabilities can indicate the liquidity of your business and your ability to pay your debt. This assessment is crucial for creditors evaluating the risk associated with lending to or doing business with a company.
A balance sheet has two sections, assets and liabilities & equity, which are divided into parts.
Assets are resources owned or controlled by the company that have economic value. Under assets come two sections: current assets and fixed assets.
- Current assets are the resources that can be liquidated quickly for immediate needs like hard currency, inventory, and accounts receivable.
- Fixed assets are resources with a longer useful life, not intended for immediate conversion to cash (e.g., equipment, office building, trademarks, etc.)
Liabilities are the obligations or debts that a company owes. This, too, may be divided into two sections.
- Current liabilities are obligations that are due within one year or a specific reporting period (e.g., taxes, accounts payable, short-term loans)
- Long-term liabilities are obligations due after one year or a specific reporting period.
Equity is the face value of assets after deducting liabilities. It includes the initial investment and any retained earnings or the accumulated profits reinvested into the business.
A balance sheet may look like this after combining the abovementioned sections.
Presenting Financial Planning Results in Stakeholders Meetings
Ultimately, how you present your financial plan and statements will determine whether you’ll get the support of stakeholders. Here are some strategies to ensure your financial plan is presented in a way that resonates with the decision-makers.
1. Organize Your Content
While having a knowledgeable presenter is important, the structure and delivery of the presentation play a crucial role in its success. Research shows that a structured presentation greatly enhances the audience’s ability to understand and retain information by 40%.
The structure becomes even more crucial during financial presentations that involve figures and technical details. In this scenario, you need to simplify your delivery – preferably chronologically. Start presenting the past and present financial figures that highlight key trends. Use the data to explain how the company’s financial position aligns with its strategic goals and objectives.
2. Be Concise
Simplifying the interpretation of results for stakeholders will enhance your ability to achieve your objectives with them. As mentioned earlier, banks, investors, and even company executives frequently prioritize understanding whether you can generate income. Hence, you need to weed out irrelevant information for them and highlight the important metrics of your financial statements.
You will benefit from using a presentation template with charts, graphs, and other visualizations so stakeholders can better interpret the financials of your business. For example, instead of exporting an entire 3-year income statement, you can use a timeline concept slide to show the trend of your net profit over the years.
3. Prepare to Address Stakeholder’s Concern
Money is a topic that often elicits strong emotions and concerns, sometimes positive but mostly negative. When presenting a financial plan, especially one involving sensitive or complex matters, it’s essential to be prepared for difficult questions that may arise from your audience. This could include addressing risks, clarifying financial projections, and explaining assumptions.
Always anchor your responses on tangible data. If a question pertains to potential risks, you may share success stories or instances where similar concerns were addressed successfully. Transparency builds trust even if the answer is not what the audience wants to hear. That said, offer alternatives to show you’ve considered various possibilities and are prepared to address them.
Conclusion
We’ve seen the components that should make up your financial plan and how you can present them to stakeholders. Collectively, they paint the bigger picture of how you can manage existing resources to achieve revenue generation while navigating the challenges in the competitive business landscape.
Financial planning is difficult because many elements come into play that ultimately affect your projections and financial results. If you lack expertise, enlisting a specialist to assemble your financial plan is prudent.
1. Down & Up Slide Graph to Represent Financial Fluctuation
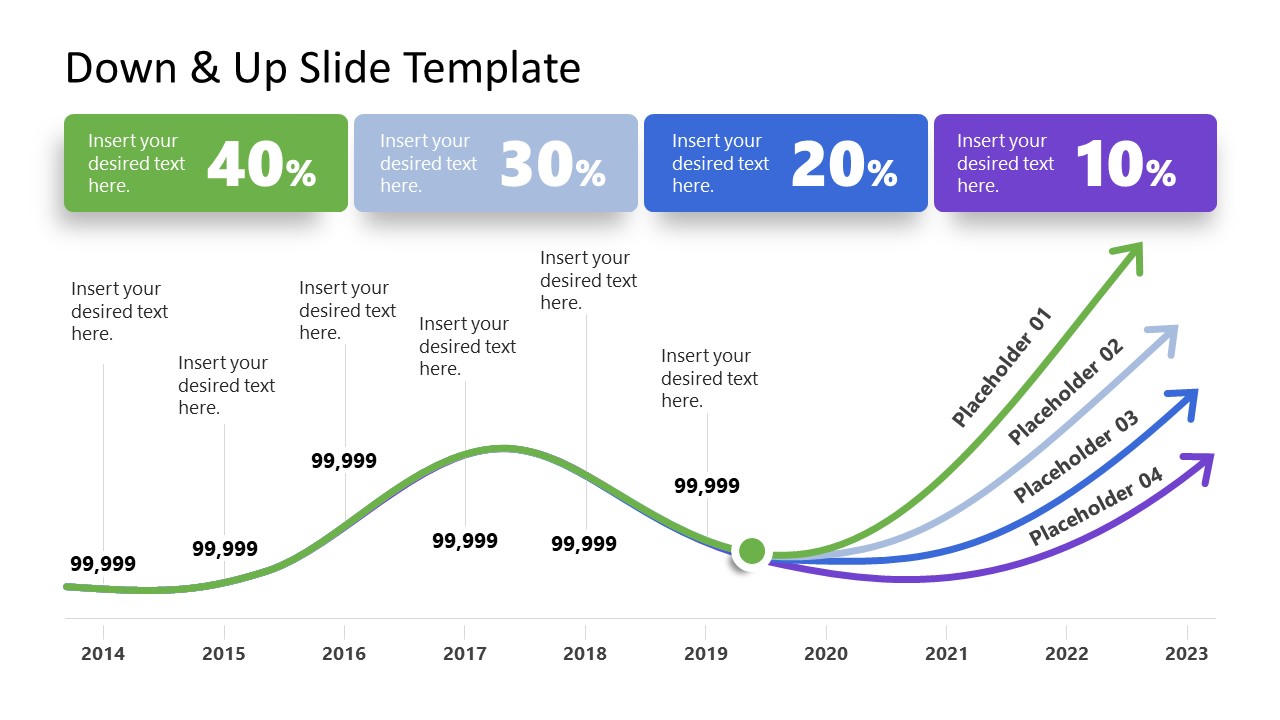
Represent the different trends of a company’s revenue generation with a visual method, faster to appreciate than simple numerical data. This template can expose the changes in annual revenue profit by year, giving room to generate projections in your financial plan strategy.
The up and down trends are entirely modifiable to accommodate our required numbers, and the different arrows starting from the final historical data point can be used to program the estimations by implementing one strategy or another. At the same time, we can use this graph to show multiple sources of income if we consider each arrow the total sum of revenue per income stream – ideal for financial growth strategies that pose a risk higher than expected, so we can contrast data with accuracy.
2. 5 Year Budget Financial Plan Diagram
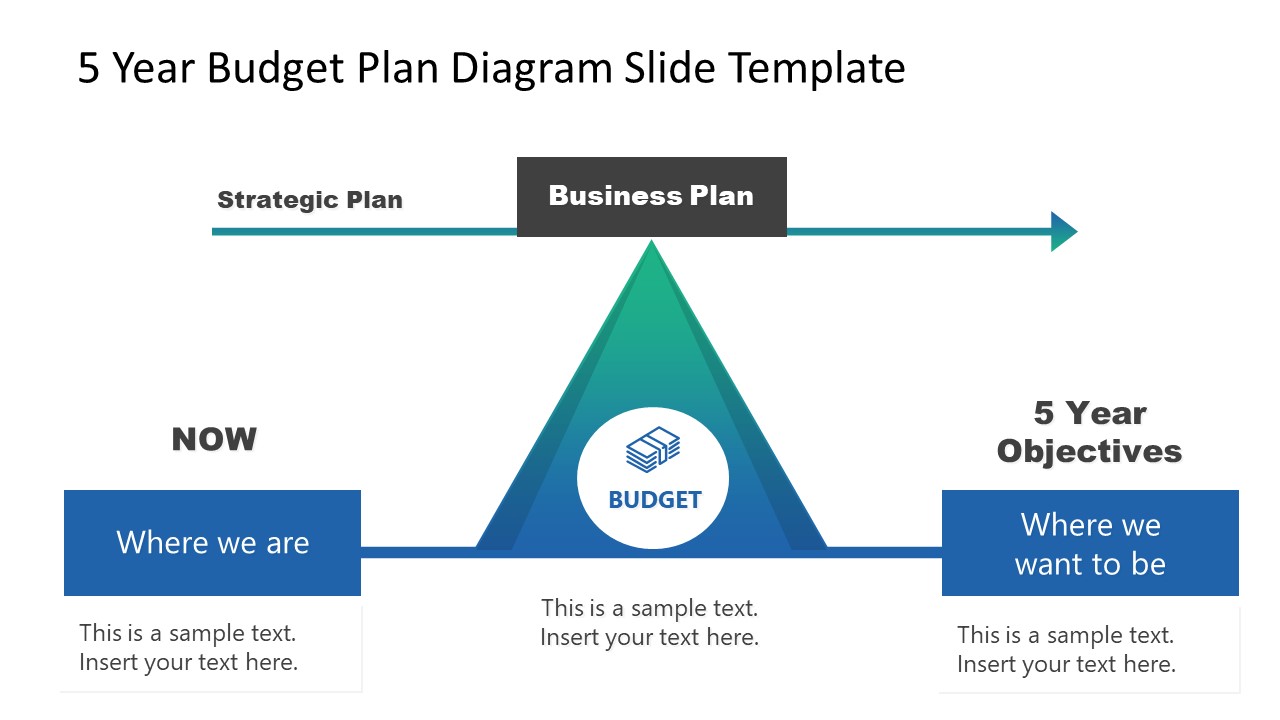
Present the required budget for a 5-year financial planning strategy in a straightforward graphical format. This presentation template shows three stages: the current moment (Now), the core budget area, and the objectives to attain within 5 years. By using this budget plan presentation template, professionals can indicate how the required budget will help achieve the company’s pre-defined milestones or any personal financial planning strategy.
3. Dashboard PPT Template for Financial Planning Presentations

Showcase financial balance in a financial plan presentation by using a highly visual profit and loss dashboard template for PowerPoint. This kind of dashboard is used to discuss the alignment with current financial and business goals, and presenters can talk about historical data, net profit per period, operational and non-operational expenses, and represent how much of the yearly income is spent on those costs. With a striking color scheme, this profit and loss dashboard slide will help professionals to discuss data in detail with ease.