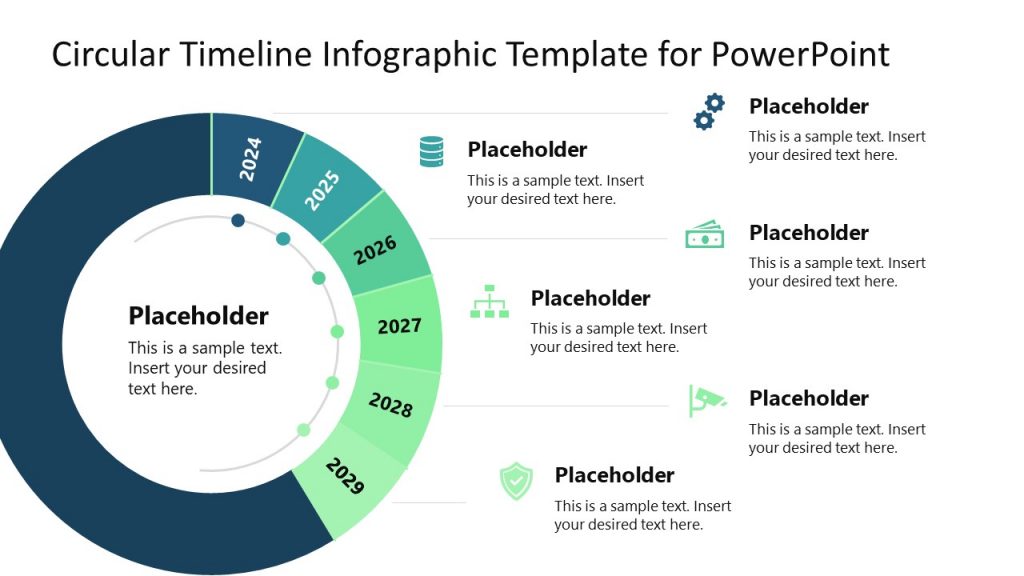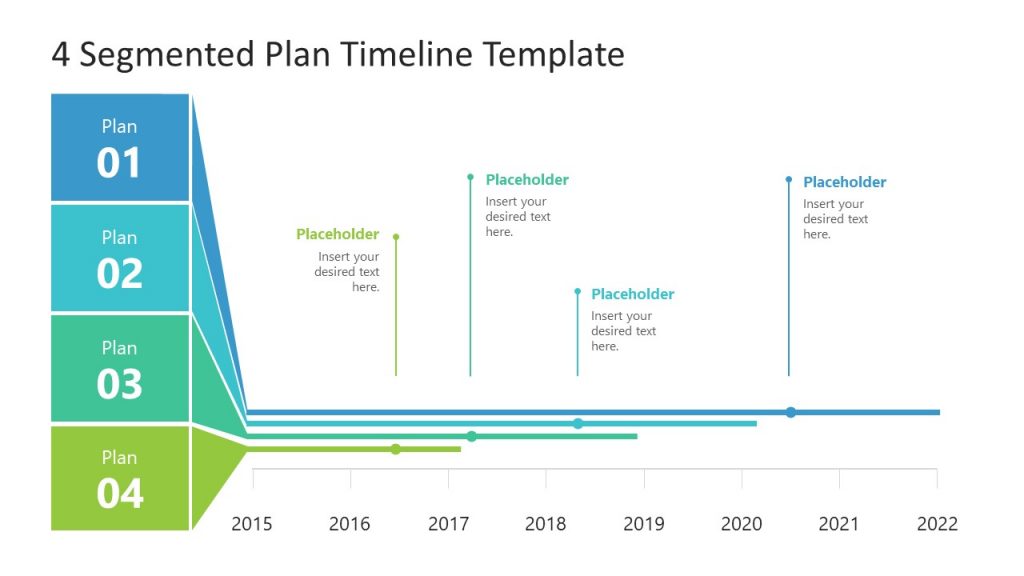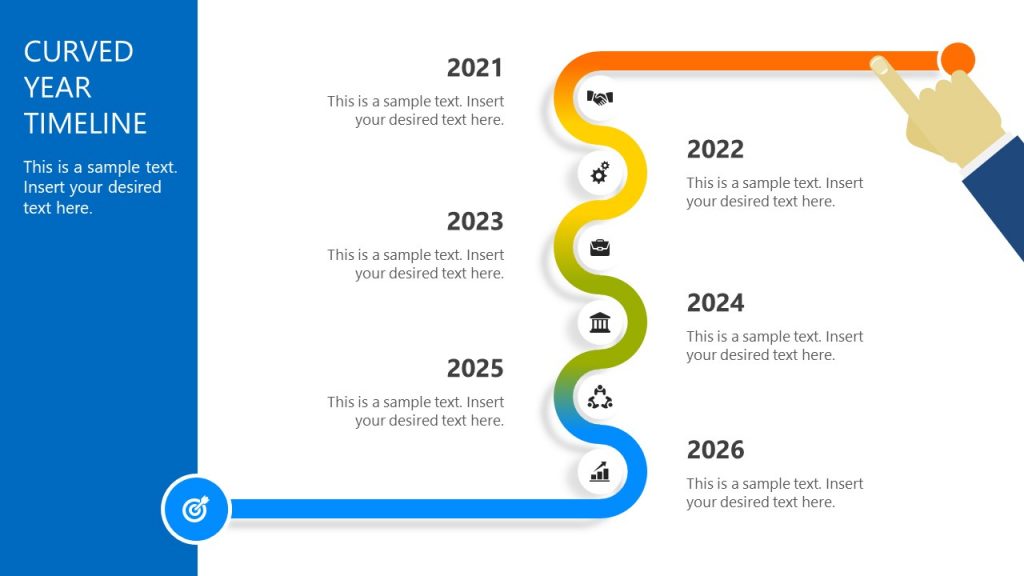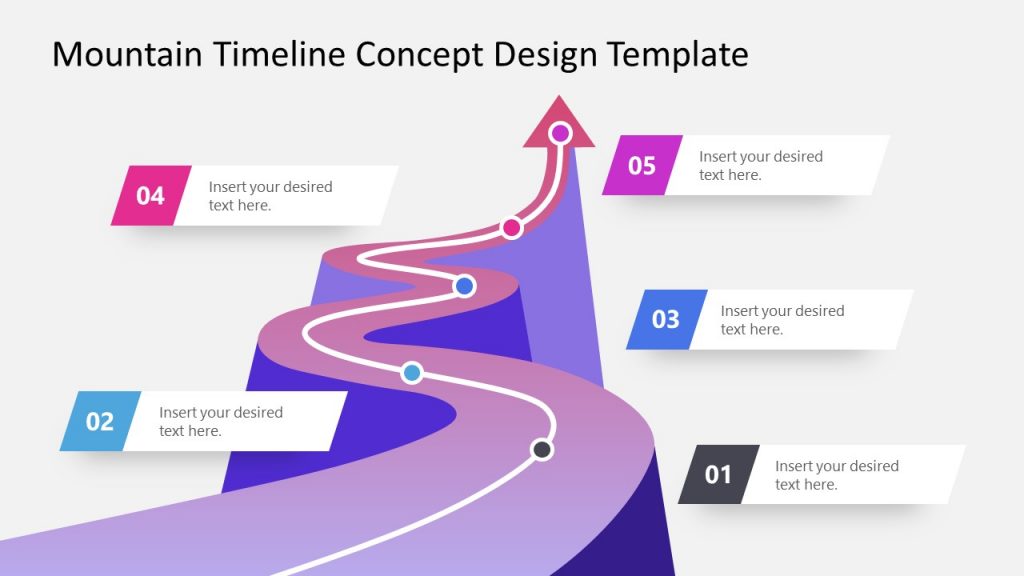
Timelines are used for a variety of purposes by people across different professions. You might be a project manager looking to create a timeline to understand the outputs and outcomes of your project or a teacher looking to teach your students about all major happenings leading up to a historical event. Timelines are a good way to visualize past, present and future events, to forecast outcomes and to learn from the past.
- What is a Timeline?
- History of Timelines
- Why Timelines are Important in Presentations
- Different Timeline Styles
- Ingredients of a Successful Timeline
- How to Create a Timeline in PowerPoint?
- How to Create a Timeline in Google Slides?
- Other Creative Timeline Designs (Infographics & Examples)
- Examples of Best Timeline Templates for Presentations
- What Makes the Perfect Timeline?
A timeline can be your snapshot into the past and a window into the expected future by analyzing the what, why, where, when and how, leading up to the things that are most important to you. In this guide we shall tell you all that you need to know about timelines and how to create them.
What is a Timeline?
A timeline is essentially a visual representation marking all major events over a period of time. A timeline marks specific milestones, achievements, or expected results tied to a specific topic. What a timeline is used for depends on a number of factors. For example, your timeline can be a graphical representation of past events, a forecast of future results or expected outcomes, or even a mix of past, present and future activities, events and outcomes.
Most timelines use time as a scale. The majority of timelines are linear in scale, while some timelines use a logarithmic scale. Timelines can be created in a number of ways such as with text based labels, numbers, graphs, photos and in the form of animations.
Timelines are most commonly used for educational purposes, in research and project management. However, this is not an exhaustive list. Other than use for business and academic purposes, timelines have been applied to learn about the spread of pandemics, chronology of the universe, and to understand scientific processes.
History of Timelines
Timelines have been used for centuries to chronicle events. Timelines have been an effective tool in recording history and learning from the past to determine the effect of past events on the present and the future. Man has chronicled events and written memoirs to record history since time immemorial. These were perhaps methods similar to create a timeline of important aspects of history. However, not all such records contained specific dates. Moreover, recording history was not necessarily done in the form of short timeline visualizations as we often see in the form of modern timelines.
Perhaps the earliest examples of timelines are historical records that were maintained by scribes and historians on the instructions of kings. In fact, scribes performed many tasks that modern timelines serve including; recording the amount of crops harvested, forecasting demand and supply, as well as keeping accounts for ordering supplies. This is somewhat similar to what most project managers do. They plan, anticipate and ensure the implementation of project goals and outcomes in line with set timelines. For this purpose, they use historical and present data, as well as forecasting models. They align their teams in line with the set timeline and offer course correction, as needed. For this purpose, a visually appealing historical timeline template can be a time-saver for educators and historians who need to prepare their presentations.
Modern timelines that we see today can be assumed to have origins as old as recorded history. In fact, this recorded era which roughly spans to 3500 BC has some form of timeline related aspect, as one can trace back events chronologically across multiple civilizations; be it Mesopotamia & Sumerians, or the Roman, Greek, Arab, Chinese, South Asian and other civilizations.

Why Timelines are Important in Presentations
Timelines serve as an essential way of simplifying content within presentations and making it easier to grasp for an audience. Instead of explaining about a concept, project or expected outcome by going back and forth; it can be much easier to simply use a timeline to show the entire layout in chronological order. This ties all aspects of the topic with a thread like symbolism which makes it easier to explain, plan, brainstorm and visualize ideas.
Business presentations, for instance, often require explaining lengthy and cumbersome concepts and ideas in a small time span. Whether you’re pitching your idea before a potential investor, need to explain the forecasts for a project, wish to reveal details about current progress or need to elaborate upon past events; a timeline can make your job so much easier. They can essentially help answer the why, what, when, how and where in the form of a simple visualization.
Different Timeline Styles
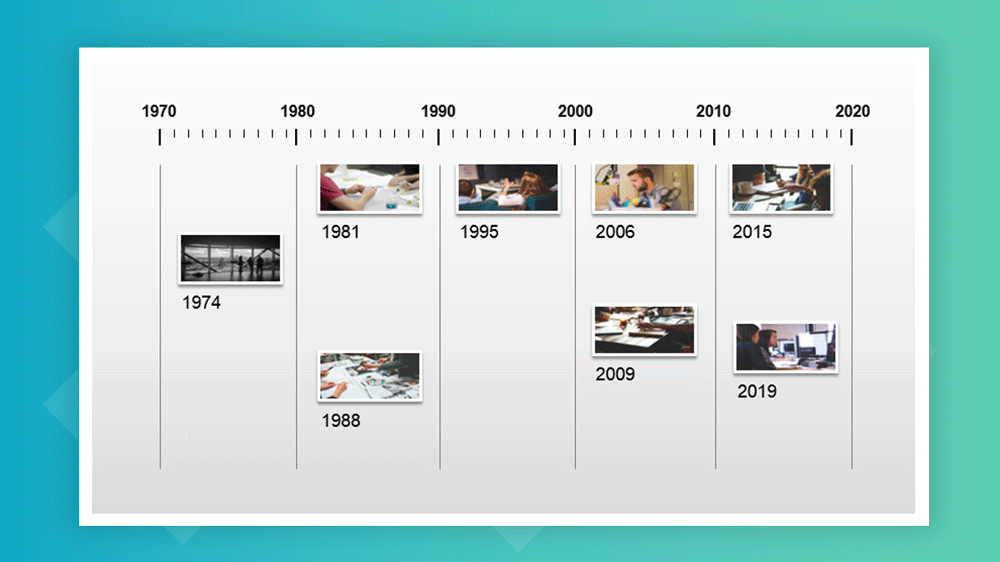
There are a number of timelines styles that can be applied when making a timeline. The way you construct a timeline is actually quite subjective. It can be hard to put all timeline styles in a box considering the various tools that have now made it possible to construct timelines in so many different ways. Below is a breakdown of some of the timeline styles that you can apply when making timelines.
Horizontal Timelines
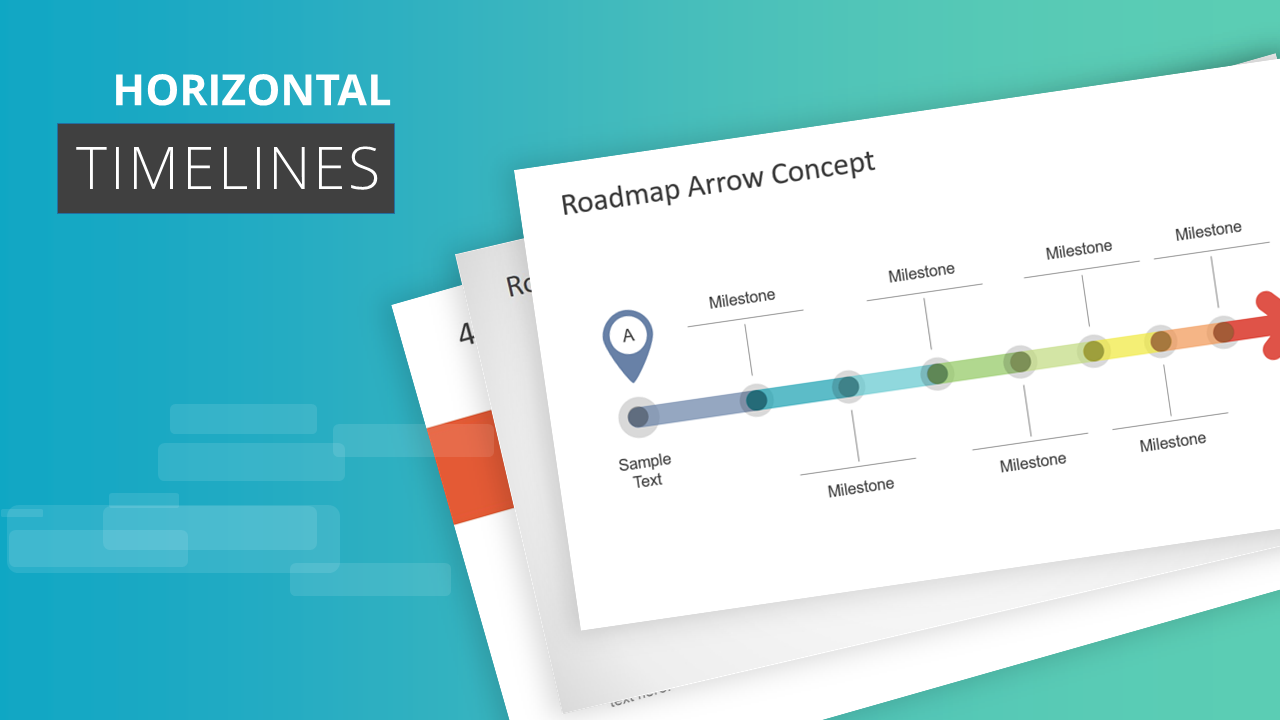
A horizontal timeline can be useful for showing progress. Such a timeline can be good for representing events chronologically. Horizontal timelines are one of the most common type of timelines and are great for project management, depicting historical events and forecasting.
Vertical Timelines
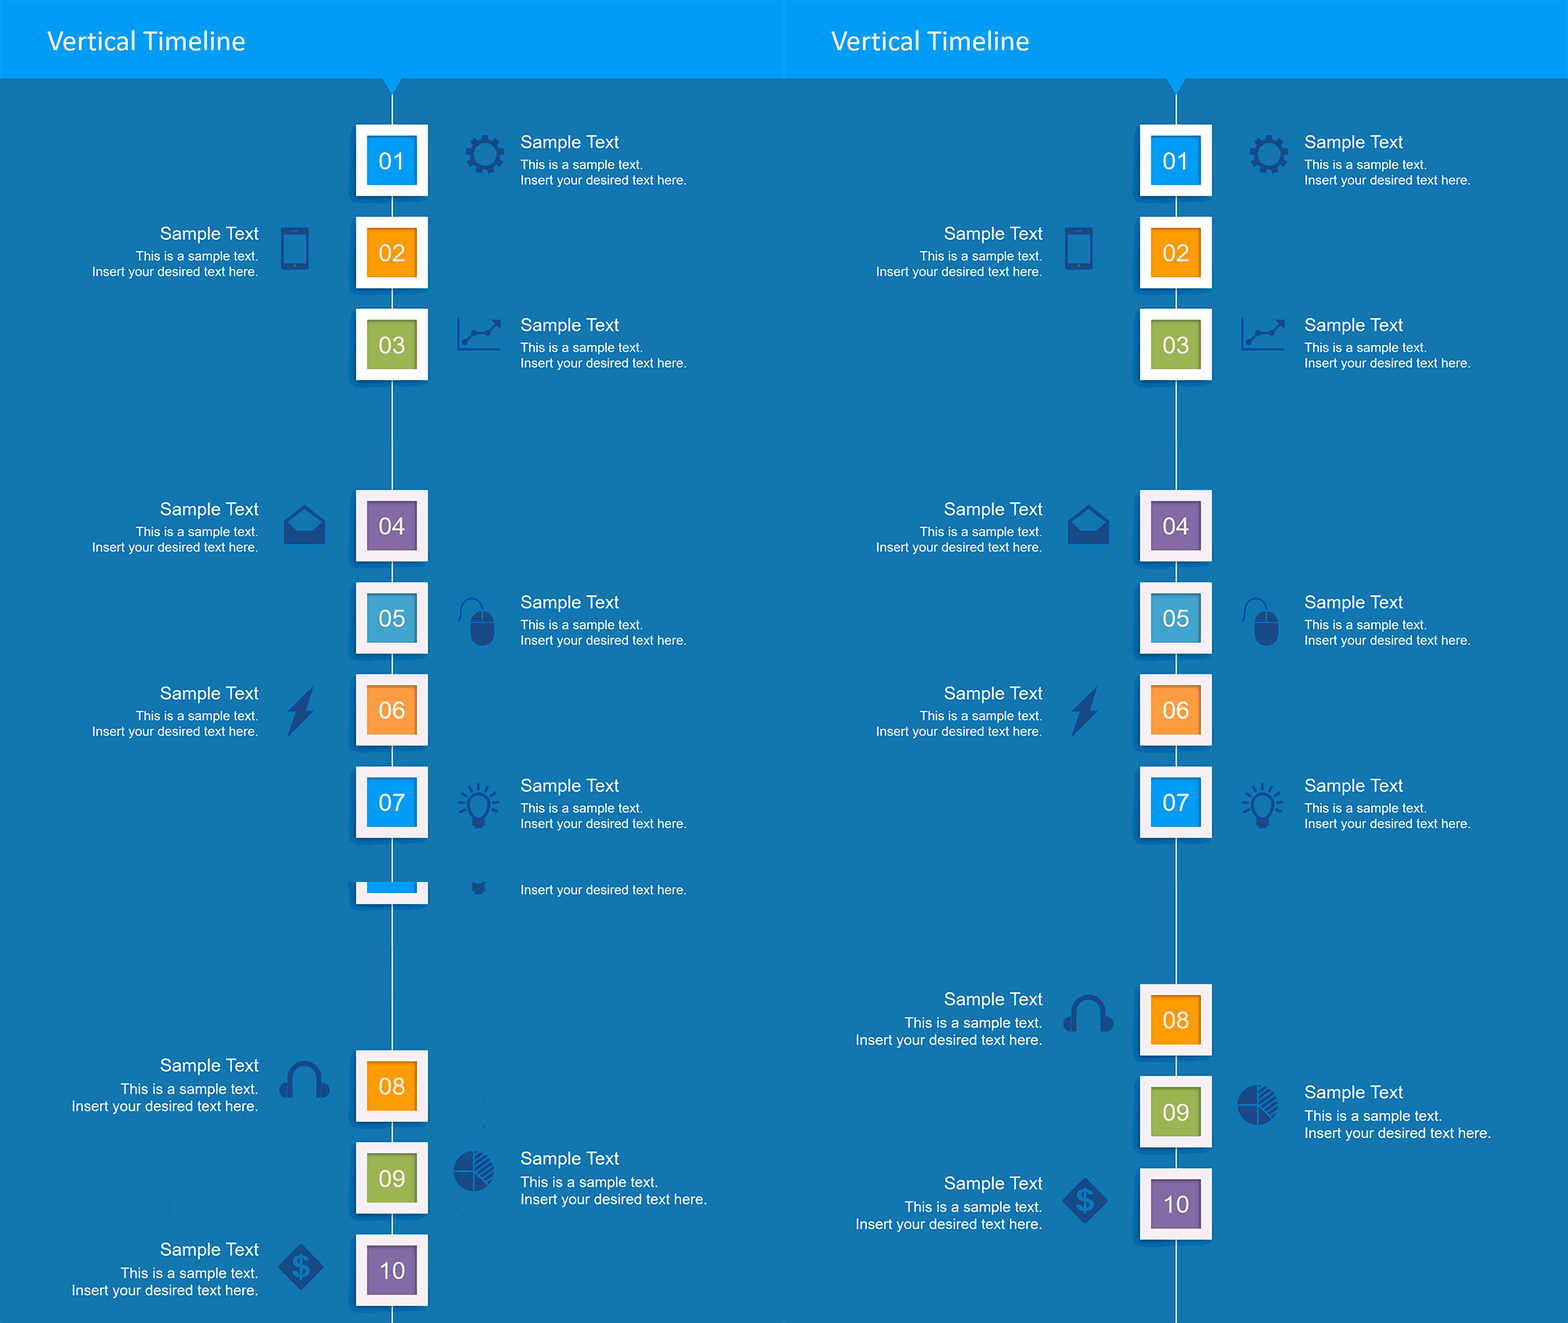
A vertical timeline template can be useful for constructing graphs and representing research data. Such a timeline can also be created using an axis to discuss variables affecting an outcome. Needless to say, vertical timelines can also be used for project management, forecasting and representing events chronologically.
Non-Linear Timelines
These can come in radial, spiral or arbitrary forms. These are often represented in the form of chains and interconnected shapes (e.g. arrows) or snake like lines. These timelines might not have a set horizontal or vertical sequence, as they represent interconnected pieces. Such timelines can be useful for depicting processes and discussing multiple variables and for longer event sequences.
Animated or Interactive Timelines: Such a timeline can be made in a number of ways. You can bring together aspects of horizontal, vertical, and non-linear timelines. This is because the ability to create a timeline by bringing together different variables affecting it can result in endless possibilities. Zooming UIs like the one used in Prezis and HTML5 based web apps, and powerful platforms like Microsoft SandDance running with Power BI can help you affect the timeline by selecting multiple variables. Such timelines can remain in flux as you apply data to visualize your content.
The new Morph transition and 3D features in recent versions of PowerPoint open a range of new possibilities to develop animated and really impressive timelines in PowerPoint.

From Tables to Graphical Timelines in PowerPoint
The tabular data were user for years. You can present your data using tables by labeling different bits of the information by date. Tables can be however more complicated and lengthy. From an audience viewpoint, tables could not help to visualize the timeline milestones easily vs. a visually appealing timeline design. If you intend to present your information before an audience, a graphical timeline can be usually easier to present than a table.
 Example of a simple PowerPoint table vs. a graphical timeline
Ingredients of a Successful Timeline
Your timeline needs to be fashioned in a manner that makes it easy enough for your audience to understand the various interconnected sections. Here are a few tips for making a timeline that can help you get your message across to an audience.
- Avoid Messy Timelines: Your timeline should be easy to understand and the various parts of your timeline should not be so intertwined that it becomes impossible to make head or tail out of it.
- Ensure Accuracy: There is no use making a visually appealing timeline if your data is wrong. Make sure that the information given in your timeline is accurate and not misrepresented. Even a single mistake in a timeline can disrupt the entire sequence.
- Account for Scalability: You must account for scalability in your timeline. Be it the design of the timeline or the process or forecast shown within it; you must ensure that the timeline can be edited to accommodate changes. This is because there might be a number of ideas, issues or instructions that might be discussed during your presentation or meeting, which might significantly alter the timeline once its presented.
- Goals & Outcomes: Most timelines come with goals and outcomes. If your timeline requires these, make sure that the goals and outcomes are defined properly. You will require emphasizing upon key milestones, and accounting for their expected outputs and outcomes.
- Descriptive Text & Labels: It is always important to ensure your timelines are properly labeled. If necessary, also add descriptive text, especially for milestones, goals and outcomes. This will help you neatly conclude your timeline.
How to Create a Timeline in PowerPoint?
Now that we learned the basics of a timeline, you may be wondering: how to make a timeline? There are a number of ways you can create timeline for your presentations or documents. One of the most common ways of making a timeline slide is in PowerPoint or Google Slides. Other online tools and specific timeline web apps can also be used. Let’s take a look at how you can quickly create professional looking timelines.
Creating a Timeline in Microsoft PowerPoint
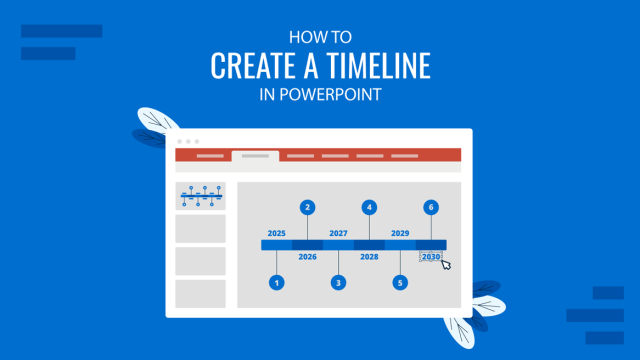
How to make a timeline in PowerPoint? Below are 3 easy steps for making a timeline in PowerPoint using SmartArt Graphics. This is probably the easiest method for making a timeline in PowerPoint.
3 Easy Steps for Making a Timeline in PowerPoint using SmartArt
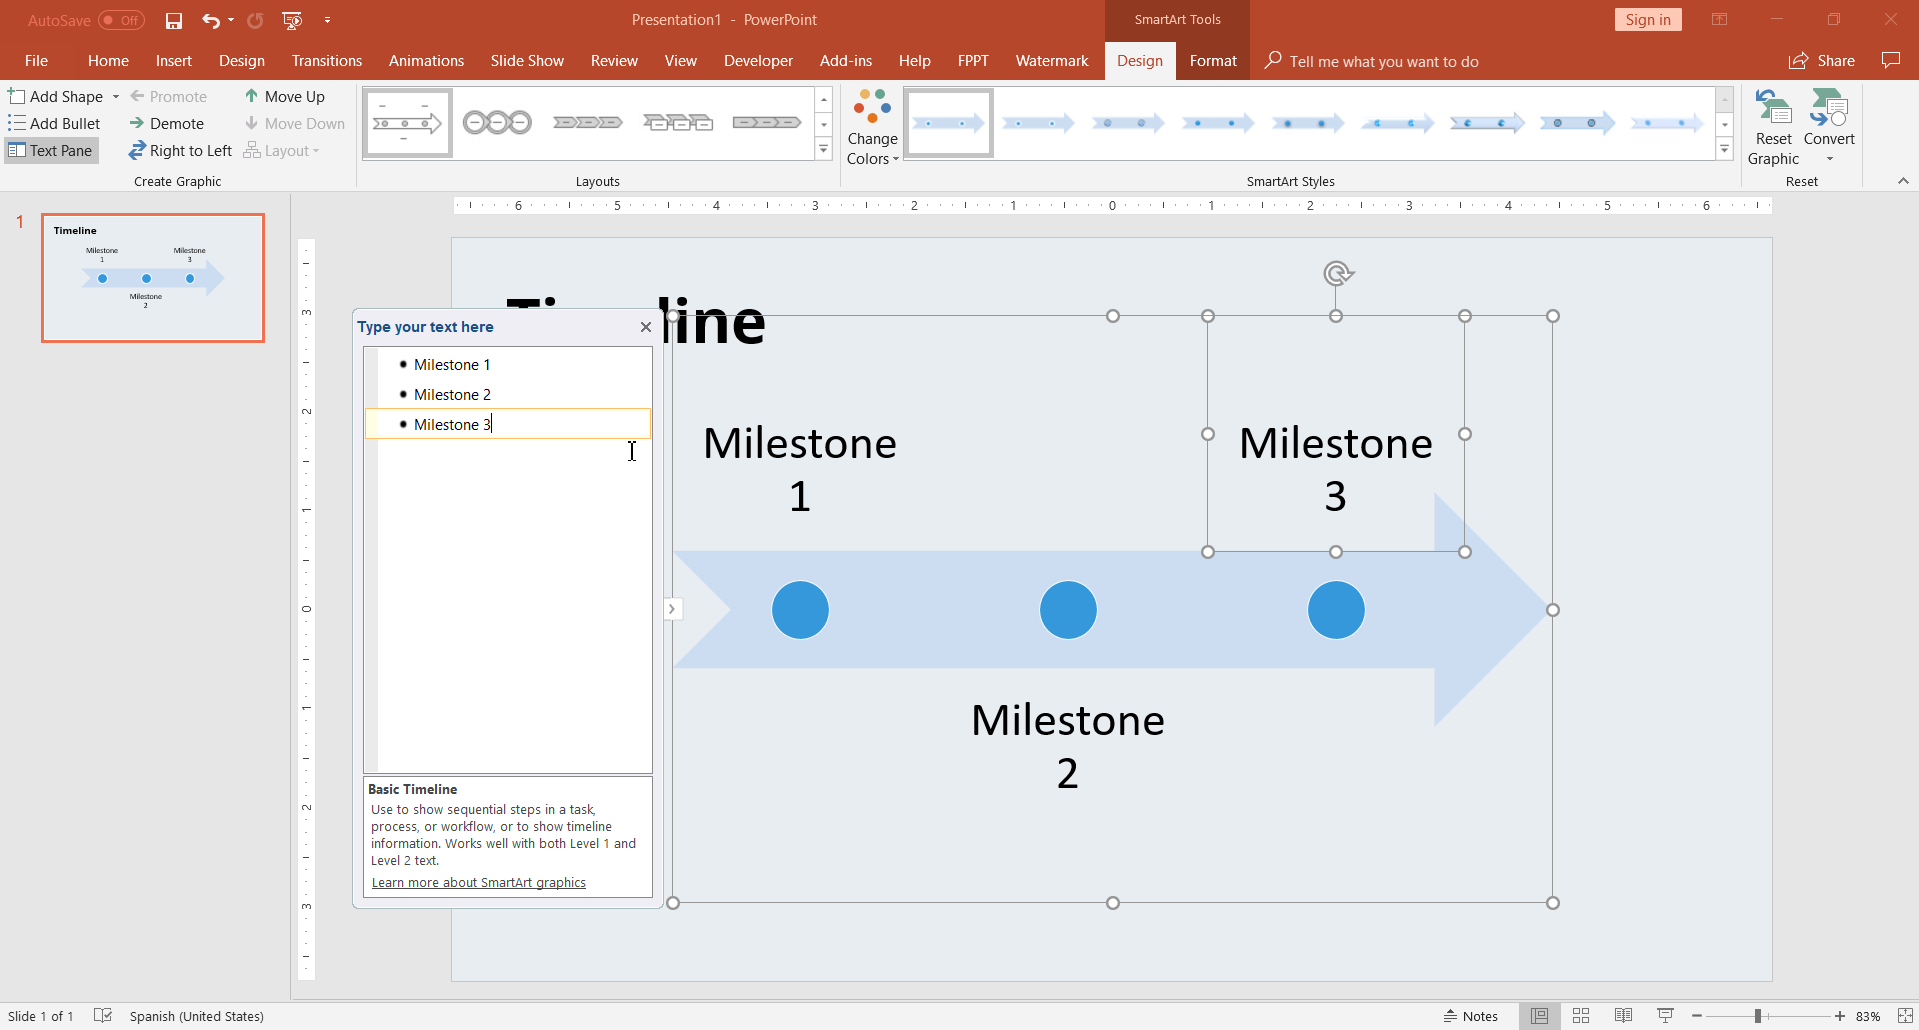
Step 1. Insert a SmartArt Graphic: Go to Insert -> SmartArt and pick a SmartArt Graphic. For making timelines, you might want to use Process based graphics. These can be easier to use for depicting a timeline like sequence. Some of the graphics in this section are specifically meant for timelines, such as the Basic Timeline graphic which depicts an arrow.
However, you can pick and choose a graphic according to need. For example, some of the graphics might not give you enough margin to add a lot of text or doing so might make the graphic confusing. Hence, pick a SmartArt Graphic that you think will be best to accommodate your content, like the Basic Timeline option. This way, you can add a timeline to your PowerPoint slide.
Step 2. Add text to your SmartArt: In the next step, add text to label your timeline and if necessary, to add a description describing each step of the timeline. For some timelines, a simple label might be enough, as you might need to keep the graphical elements minimum to describe each step during your presentation verbally.
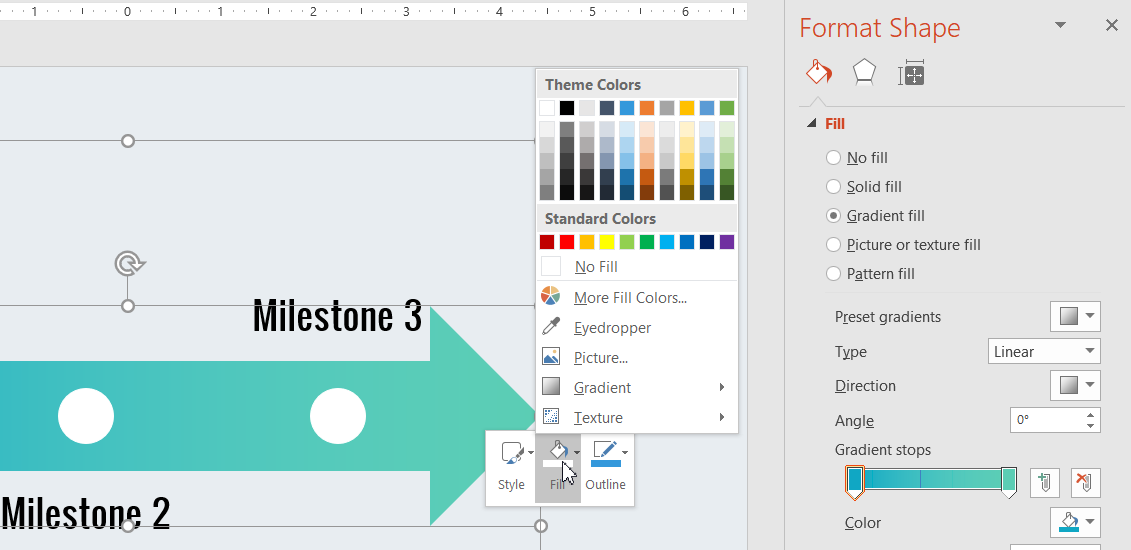
Step 3. Design your timeline: You can design your timeline by using SmartArt Tools, and picking the various color schemes given within PowerPoint or changing the shape colors. You can always switch the SmartArt Graphic using SmartArt Tools and try your hands at different graphic types to make interesting timelines. In the following example we have adjusted the fill options to a custom gradient color.
3 Easy Steps for Making a Timeline in PowerPoint using Shapes
Another easy method for making timelines in PowerPoint is by using the built-in PowerPoint shapes. You can use various shapes for designing your timeline, however, a very common shape is the Arrow shape.
- Step 1. Insert shapes: In the first step, insert a shape via Insert -> Shapes. For the purpose of this tutorial, we will use the Right Arrow shape. This is because an arrow can be quite useful for pointing towards a specific direction on the slide; making it ideal for linear timelines. You can insert multiple shapes to construct your timeline, such as a few arrows pointing towards the right.
- Step 2. Add text-boxes: You can insert text-boxes to explain each step of the shape. These text-boxes can be added both within shapes and next to them. The former can help label the shapes with dates and other relevant information, whereas, the latter can be handy for adding a description for what each shape implies.
- Step 3. Design your shapes: You can recolor, resize and reorder the shapes according to your specific timeline requirements in order to make it stand out and to highlight different parts of it by color coding it.
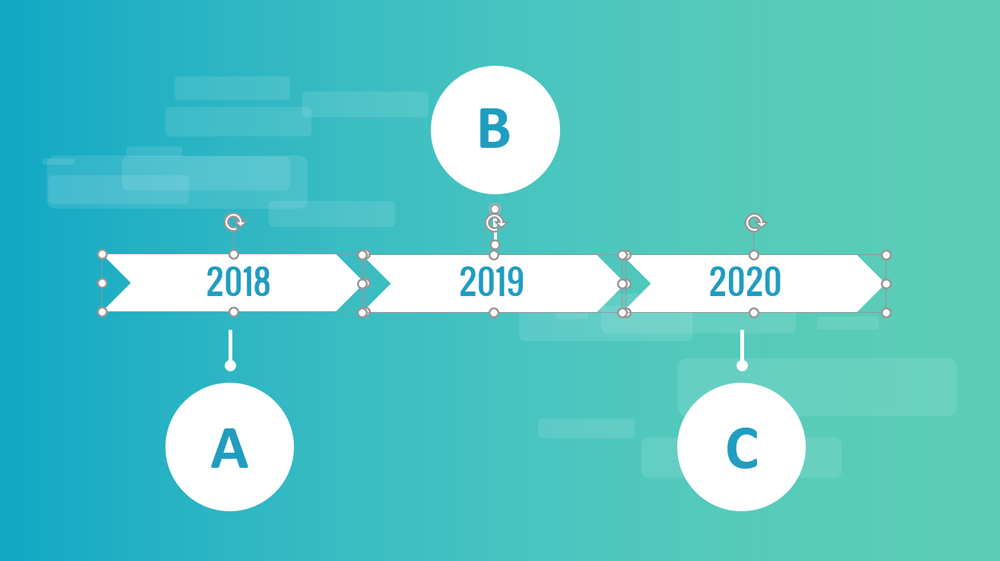
This method can be used either to create a basic timeline or an advanced timeline.
For more information, check our complete article about how to create a timeline in PowerPoint.
How to Create a Timeline in Google Slides?
Google Slides has had an impressive growth in recent years and positioned itself as one of the preferred tools when creating business slide decks and presentations for education. As in PowerPoint, Google Slides offers a wide range of tools to create timeline slides are one of the diagrams that can be created in Google Slides presentations.
How to build a timeline in Google Slides? You can create timeline templates in Google Slides by either using shapes, by using the same procedure as PowerPoint (by inserting shapes via Insert -> Shapes in Google Slides), or opt for a much easier method that can help you cut down the time needed for making timelines in Google Slides.
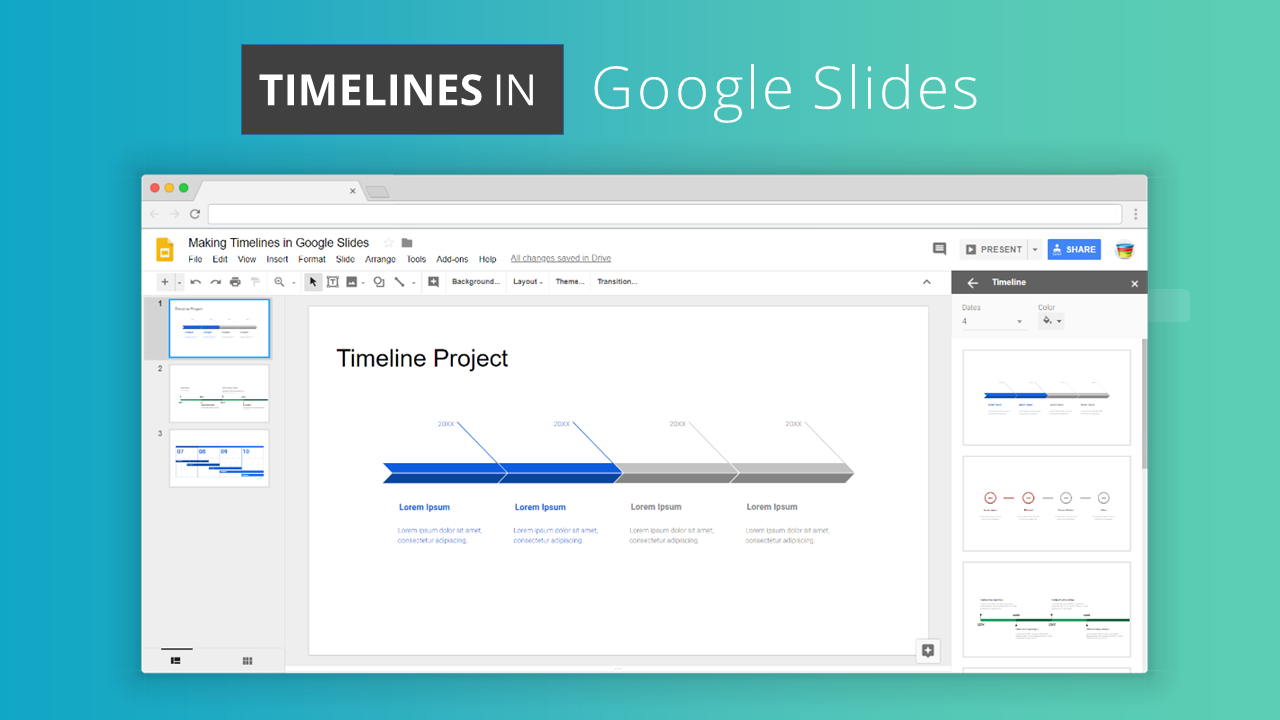 Creating a timeline in Google Slides using pre-defined diagram designs
- Step 1. Insert a timeline diagram: You can insert timeline diagrams in Google Slides via Insert -> Diagrams. There are a number of diagram types listed in this section, make sure you pick Timeline diagrams from the right pane.
- Step 2. Pick a timeline diagram template: You can choose from the various timeline diagrams given in this section. Pick the one that you think might be best suited for your timeline requirements.
- Step 3. Customize timeline diagram: Once you have picked a timeline diagram, you can customize it. You can right-click on the diagram to add animations or choose Format Options to edit the various parameters of the diagram.
The Format Options menu takes you to a pane where you can edit the size, position, shadow and reflection of the diagram, as well as to rotate it.
For more information, check our tutorial on how to make a timeline on Google Slides.
Other Creative Timeline Designs (Infographics & Examples)
An infographic is a visual image used to represent information or data. A well-designed infographic can help to simplify a complicated data structure or message into a captivating experience. Used correctly, timeline infographics can be one of the most effective strategies in digital marketing to convey a message to an audience. Infographic timelines can also be used in social media or other mediums. An effective infographic should be visually engaging and be prepared to target a specific audience.
As many other visual elements used in infographics, timelines are part of infographic design. They can help to portray history, achievements or describe how a business have evolved over the years. There are many creative timeline infographic designs and layouts. Here is just an example of a simple but creative infographic design:
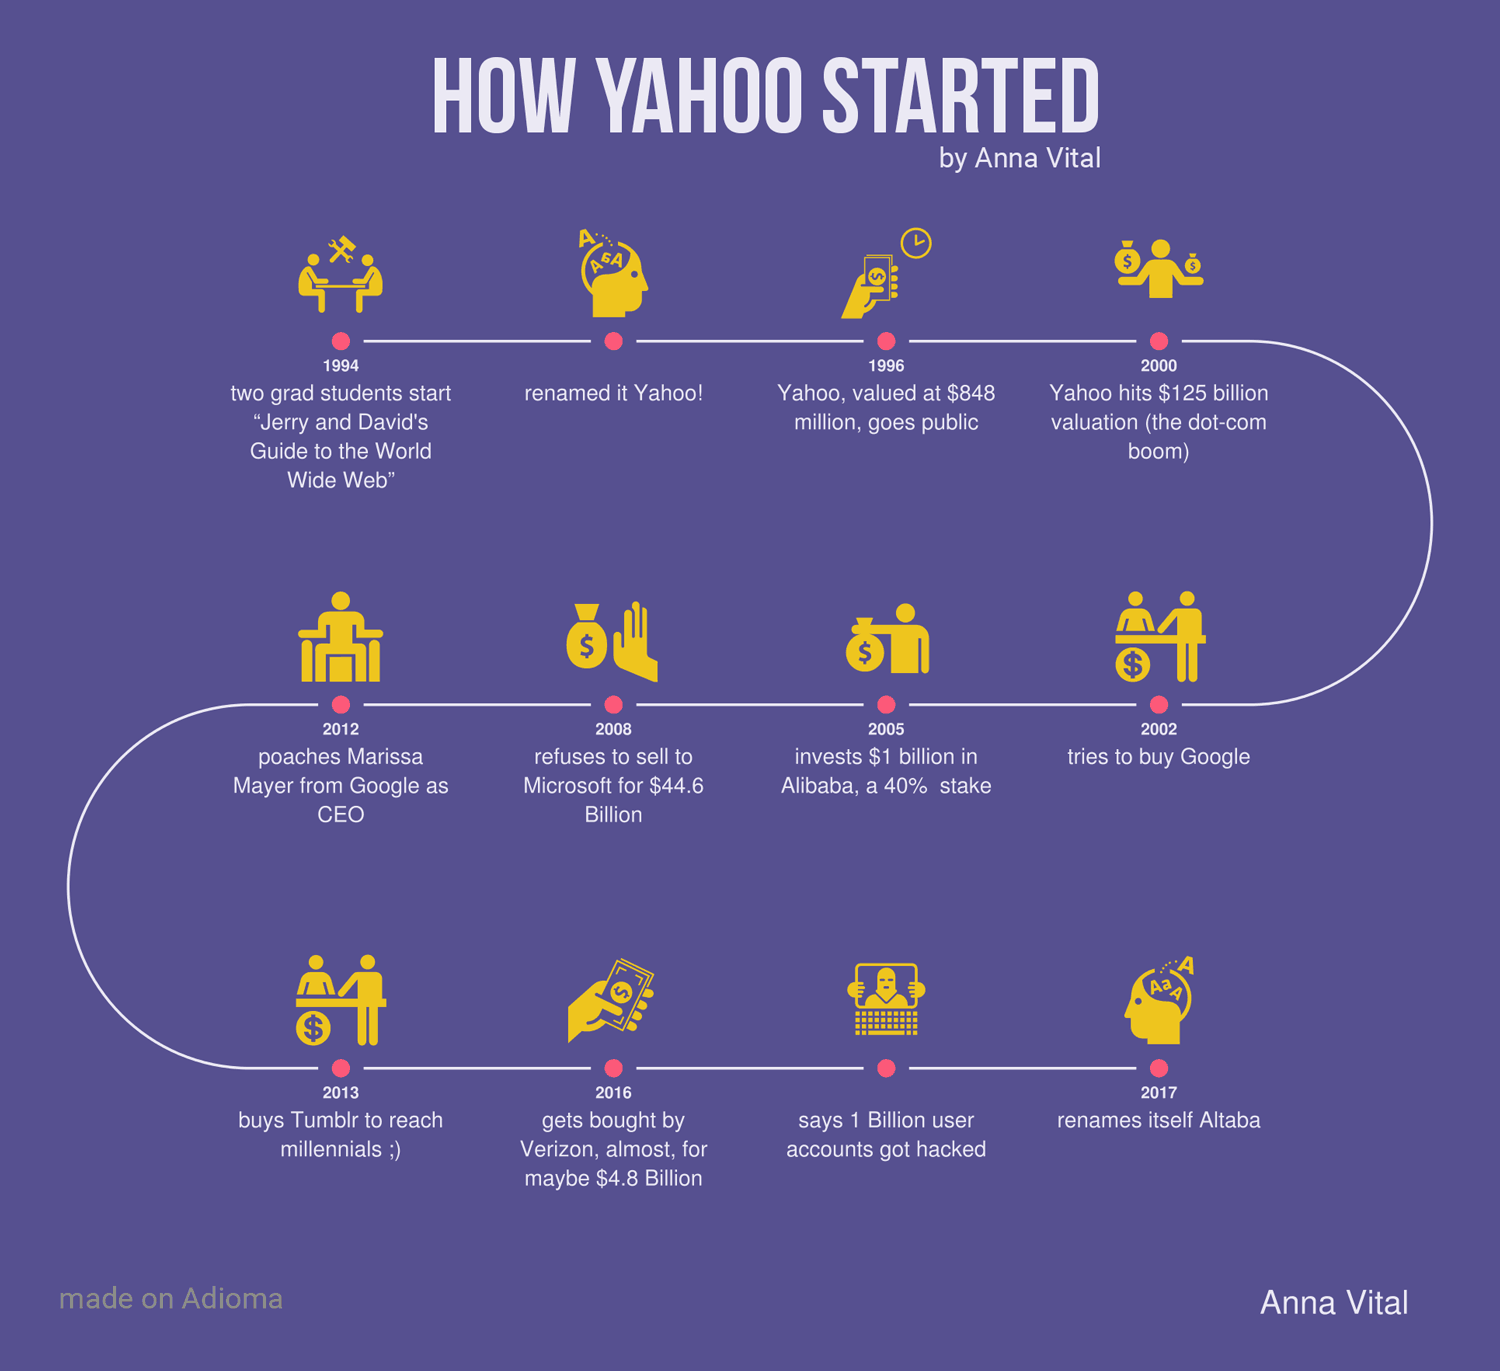
This great timeline created by Anna Vital (Adioma Founder and Information Designer) is a clear example of timeline design that helps to describe how Yahoo started. It’s simple, clear and descriptive.
Examples of Best Timeline Templates for Presentations
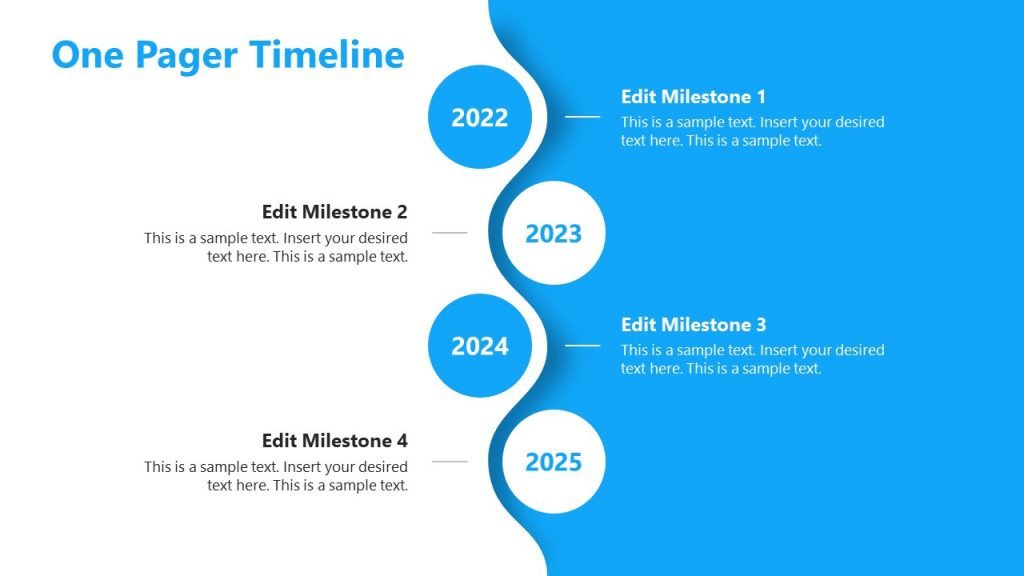
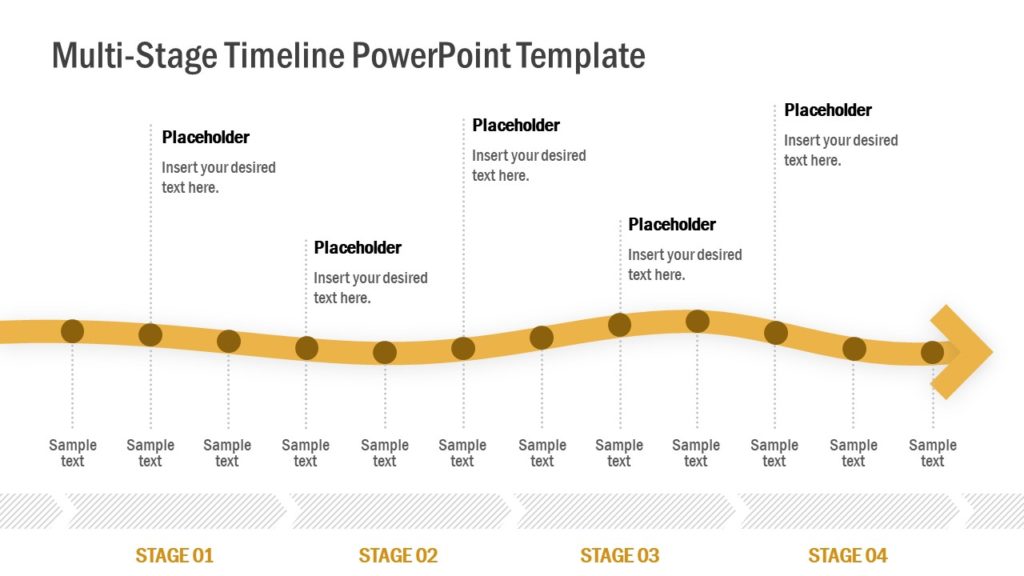
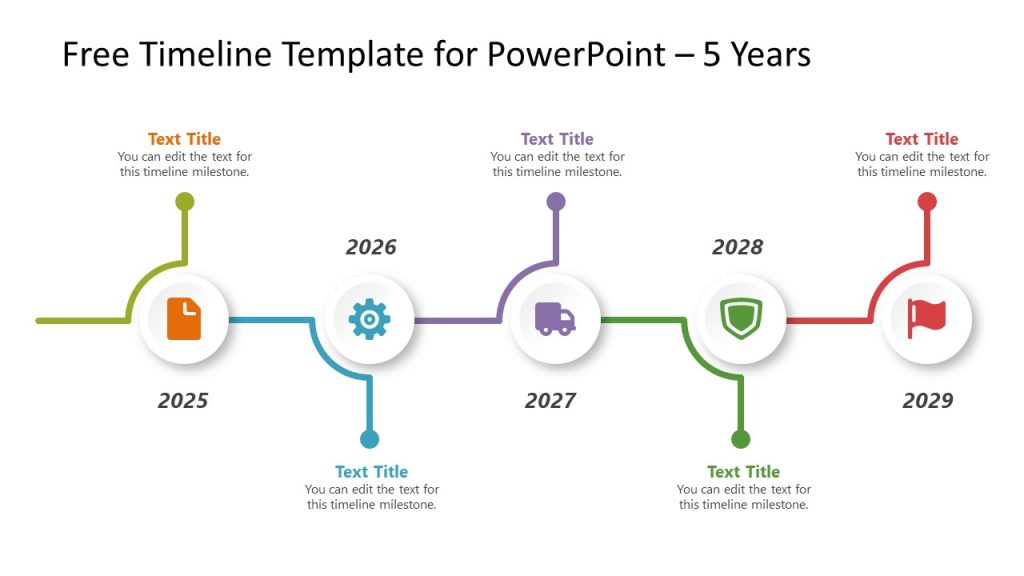
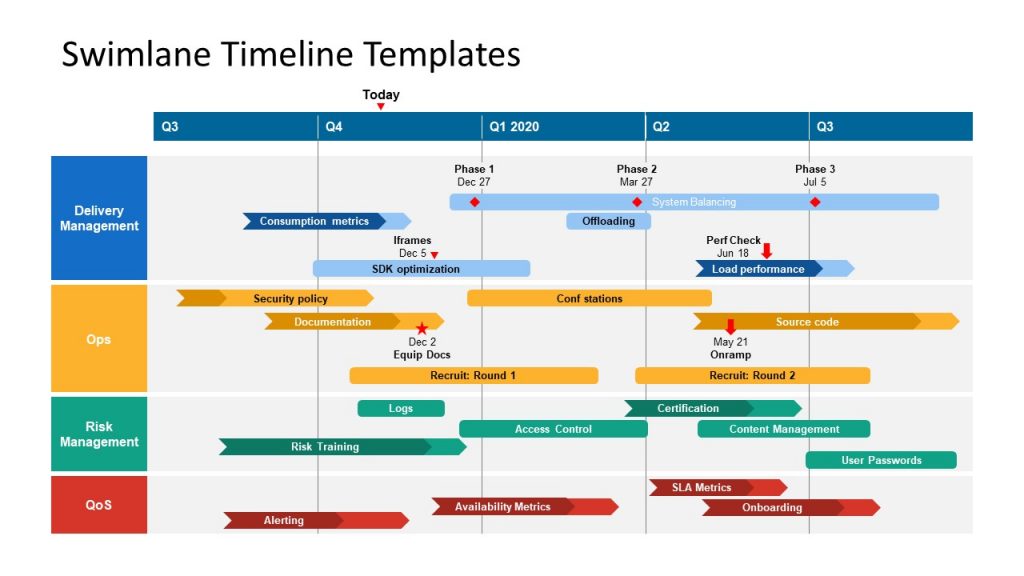
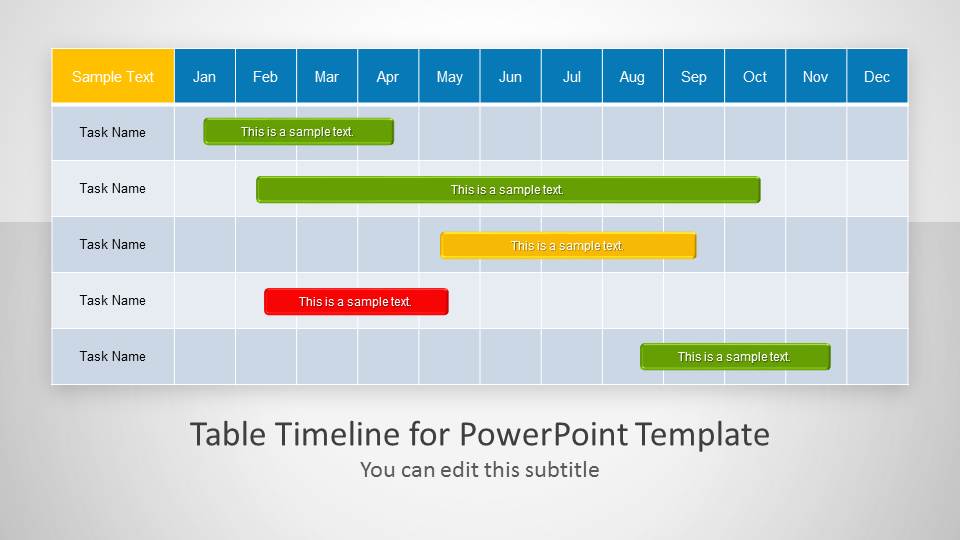
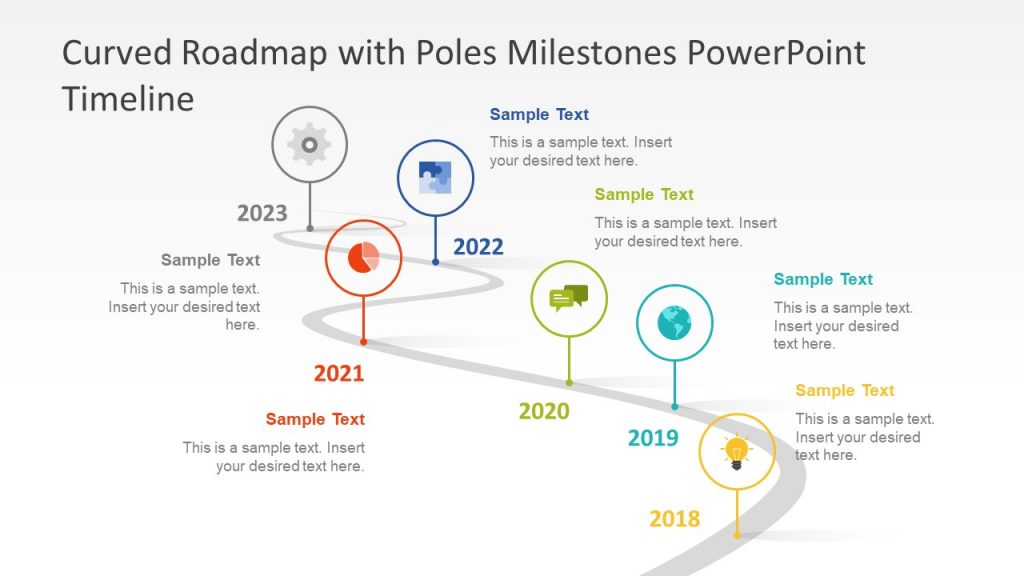
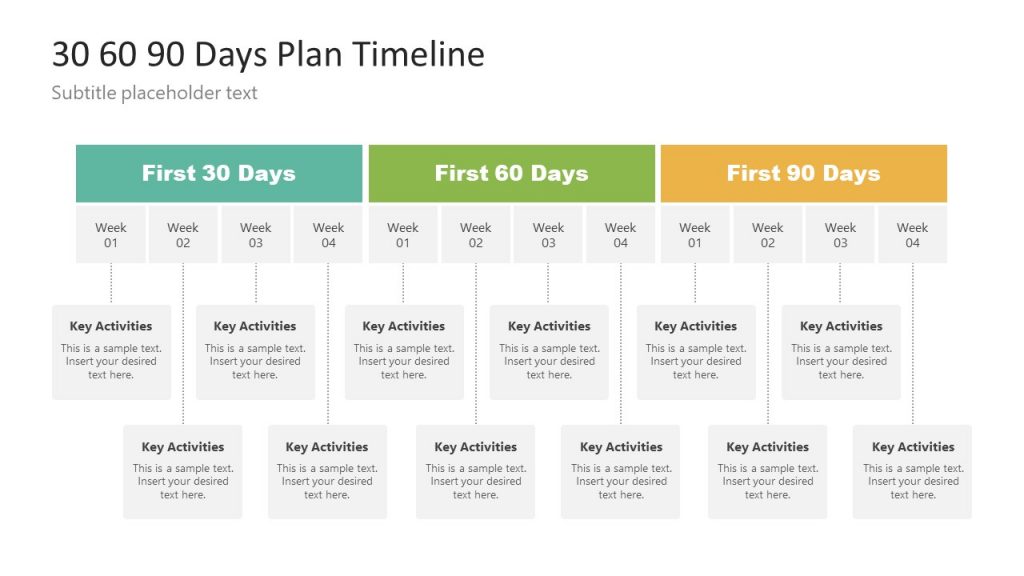
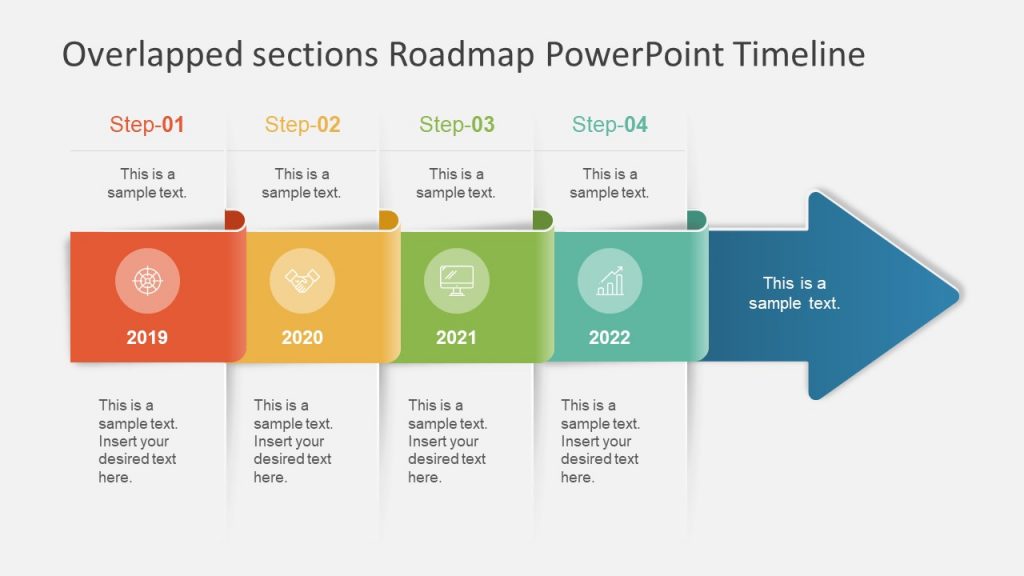
A timeline template for PowerPoint or Google Slides can help to save a lot of valuable hours. Here is a list of some of the timeline templates for PowerPoint and Google Slides that you can find in our catalog. All timelines are 100% editable and ready to be used in your presentations.
What Makes the Perfect Timeline?
There are a number of methods for generating timelines using PowerPoint, Google Slides, Web applications and a range of other tools. However, you should opt for the method that seems most suitable. For example, you might like a web application that can make a good timeline, however, if the venue at which you are to present the timeline has no stable internet connection, you might run into trouble. Similarly, you might want to animate your shapes in a PowerPoint timeline, however, it must be duly noted that this might make your slides heavy and if you are using legacy hardware, your presentation might lag. It is always a good idea to play your timeline before the presentation day and make sure everything is in place.
There are a number of flexible presentation templates that can make your life easier. These can be freely used with multiple platforms such as PowerPoint and Google Slides, providing you with both online and offline functionality to offer you more flexibility as a presenter. You can check out some of these templates from the list given below.
