Slide 10 of 13 from CIRQA Business PowerPoint Template
Performance Metrics Overview Slide – CIRQA Business Profile Template
Performance Metrics Overview for Business Growth
- Chart
- Bar Vertical
- Evaluation Slide
- 16:9
- 100% Editable
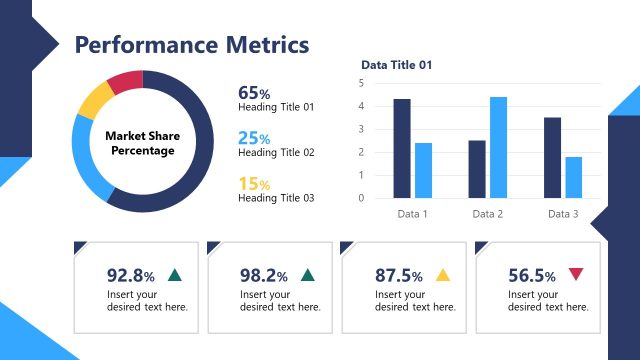
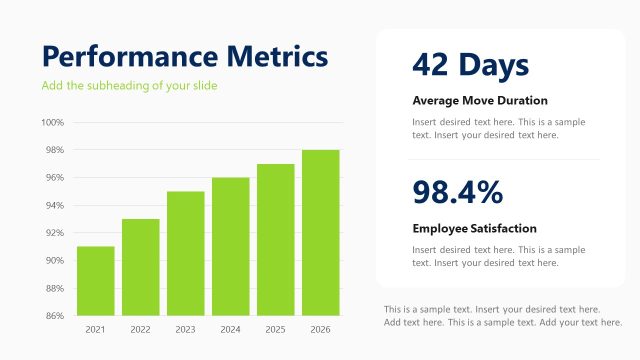
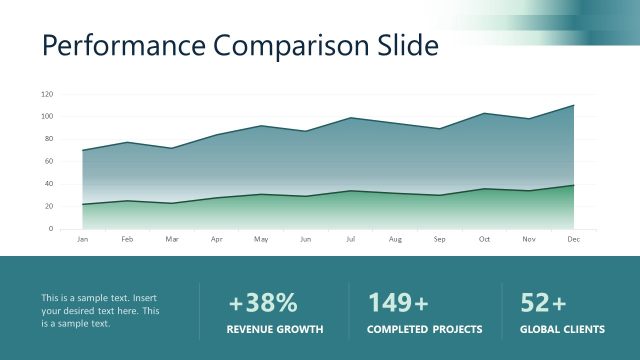
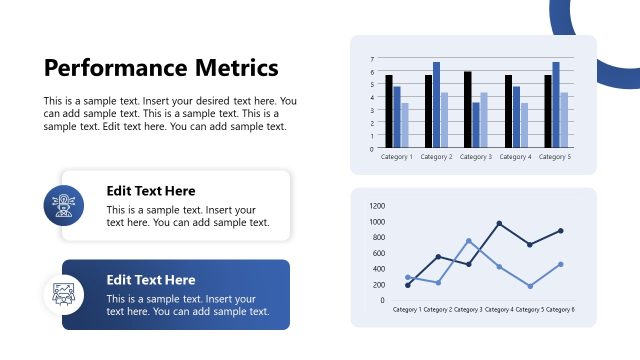
The Performance Metrics Slide from the CIRQA Business PowerPoint Template offers a clear layout for presenting key business performance indicators using editable slides with vertical bar charts and text areas. This slide template supports effective communication of revenue growth, client acquisition, and project success metrics, making it suitable for quarterly reports, investor pitches, or corporate presentations.
What’s on This Slide
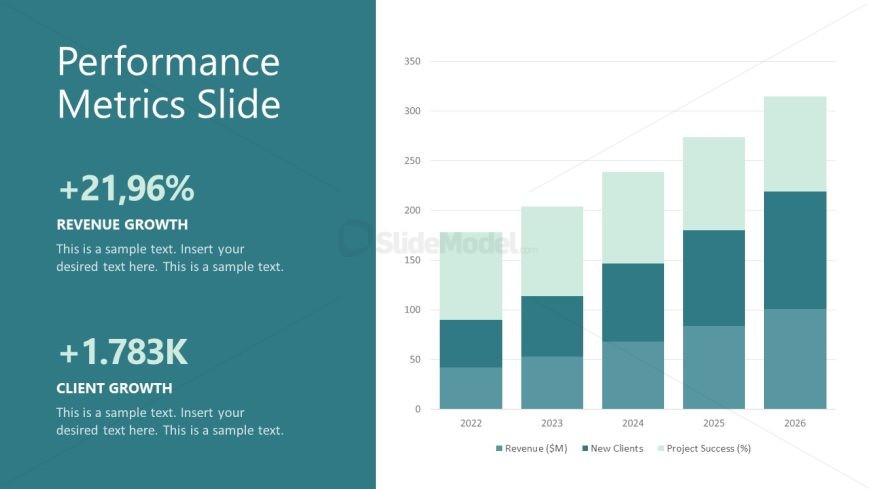
The layout features a teal background with a vertical bar chart on the right side. The chart displays three distinct bar segments for each year from 2022 to 2026, representing revenue, new clients, and project success. On the left, there are two text areas: the top section presents a percentage figure for revenue growth, with a label beneath it, while the bottom section shows client growth metrics. Each text placeholder is aligned left and separated by ample space, creating a clear visual hierarchy. The overall composition balances data visualization with textual information.
How to Use It
This layout serves to present performance metrics in a business context, ideal for showcasing growth statistics and trends. It fits well in a presentation sequence following problem identification and before strategic recommendations. Scenarios include quarterly business reviews, investor presentations, or internal performance assessments. The structure allows for clear communication of key performance indicators, making it suitable for stakeholders seeking concise data insights.
Text Placeholders & Capacity
Keep your copy within these limits so it fits without resizing. Body slots can hold about 8-10 words each.
| Placeholder | Count | Max characters (approx.) |
|---|---|---|
| Slide title | 1 | 30 |
| Body paragraph | 4 | 50 |
| Item heading | 3 | 20 |
| Item body | 3 | 30 |
Slide Keywords
Download unlimited PowerPoint templates, charts and graphics for your presentations with our annual plan.
DOWNLOADReturn to CIRQA Business PowerPoint Template.