Slide 13 of 15 from Relocation Services PowerPoint Template
Performance Metrics Slide with Data Visualization – Relocation Services Template
Performance Metrics Overview for Relocation Services
- Chart
- Bar Vertical
- Evaluation Slide
- 16:9
- 100% Editable
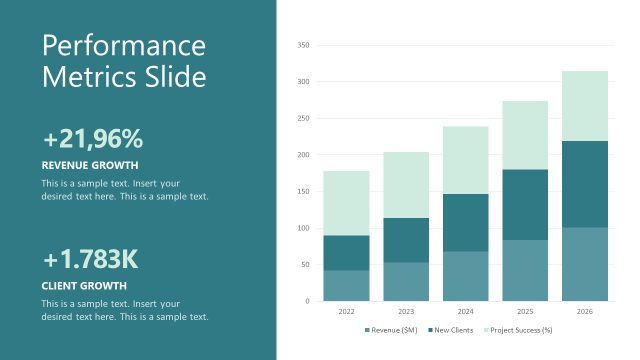
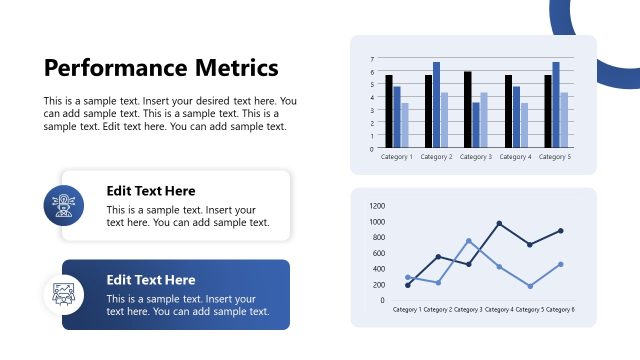
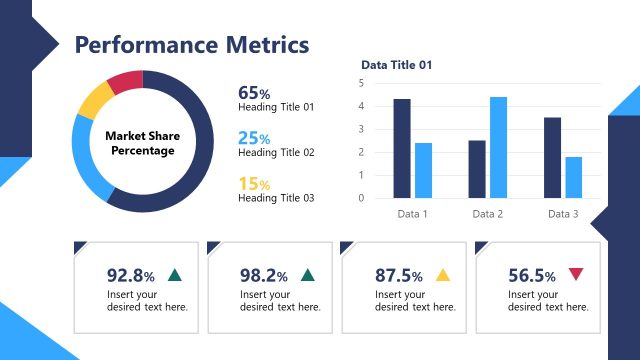
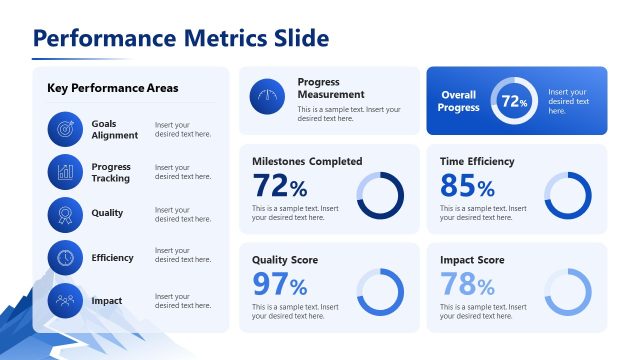
The Performance Metrics Overview slide from the Relocation Services PowerPoint Template offers a clear vertical bar chart visualization ideal for business presentations focused on performance review and service evaluation. This slide layout supports effective communication of key data trends, including satisfaction rates and operational metrics, using editable shapes and vector icons to enhance clarity within corporate presentation slide decks.
What’s on This Slide
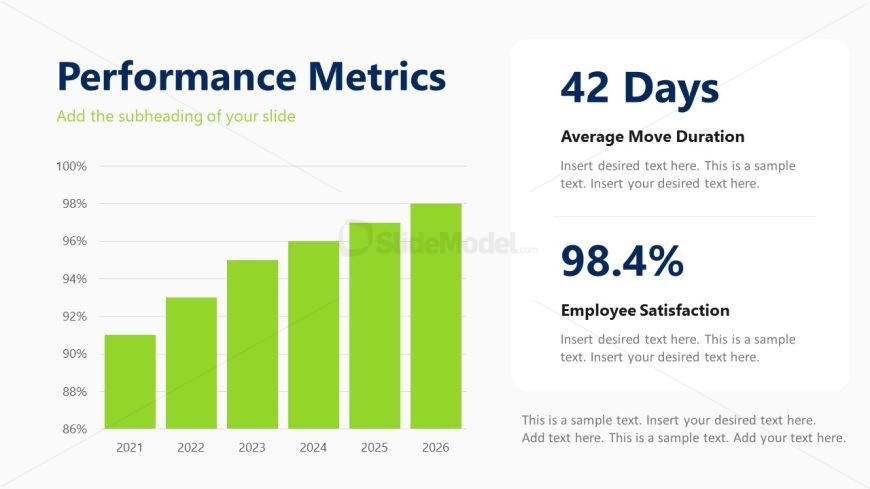
The slide features a vertical bar chart on the left, displaying performance metrics over the years 2021 to 2026. The bars are green and represent percentages ranging from 86% to 100%. To the right, there are two text areas: one highlights the average move duration of 42 days, while the other indicates an employee satisfaction rate of 98.4%. Text placeholders are present for additional details, with the main title at the top and subheadings below. The overall layout is clean, with a light background and clear visual hierarchy.
How to Use It
This layout serves to present key performance metrics in a business context, ideal for showcasing data trends and satisfaction rates. It fits well in a presentation sequence that discusses service effectiveness or operational performance. This format is useful for business reviews, client presentations, or internal assessments, where clear data visualization is essential for decision-making and strategy formulation.
Text Placeholders & Capacity
Keep your copy within these limits so it fits without resizing. Body slots can accommodate roughly 20-25 words each.
| Placeholder | Count | Max characters (approx.) |
|---|---|---|
| Slide title | 1 | 30 |
| Body paragraph | 3 | 150 |
| Item heading | 6 | 10 |
Slide Keywords
Download unlimited PowerPoint templates, charts and graphics for your presentations with our annual plan.
DOWNLOADReturn to Relocation Services PowerPoint Template.