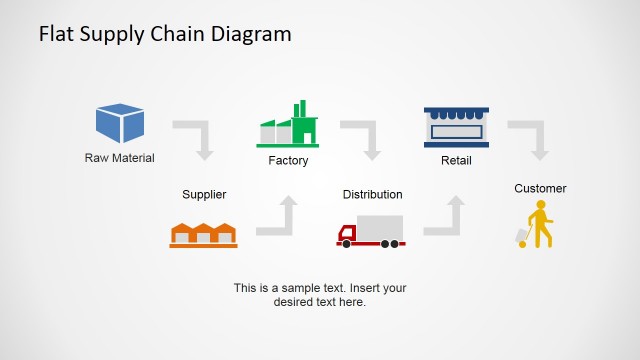
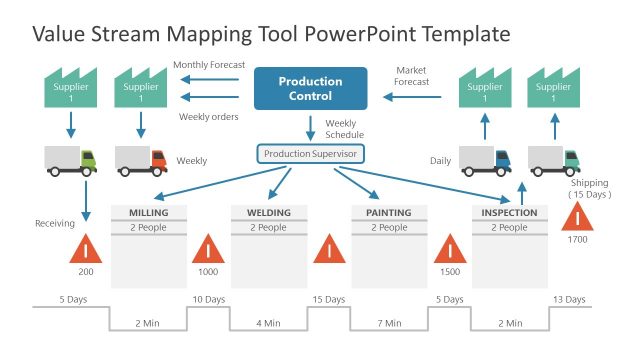
Value Chain template for PowerPoint contains useful Value Chain Diagrams that you can use in logistics and presentations on operations management, product development, customer relations and supply networks.
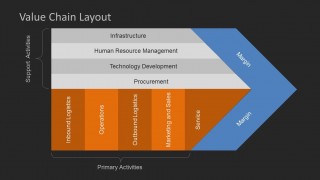
A value chain is a chain of activities that a firm operating in a specific industry performs in order to deliver a product or service for the market. This concept was originally from business management and popularized by Michael Porter in 1985. It was part of the Competitive Advantage book. You can use the Value Chain diagram for PowerPoint to prepare awesome presentations on business process operations and management topics.
What’s inside this template
Example presentation scenarios
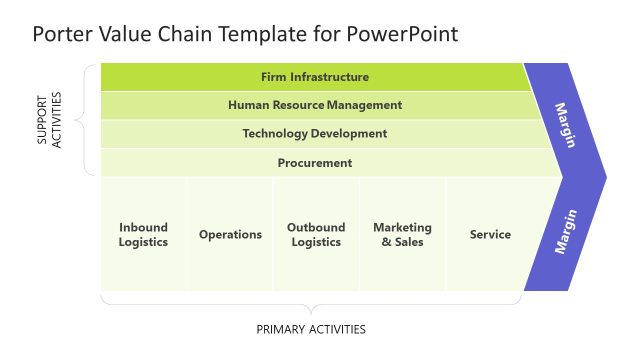
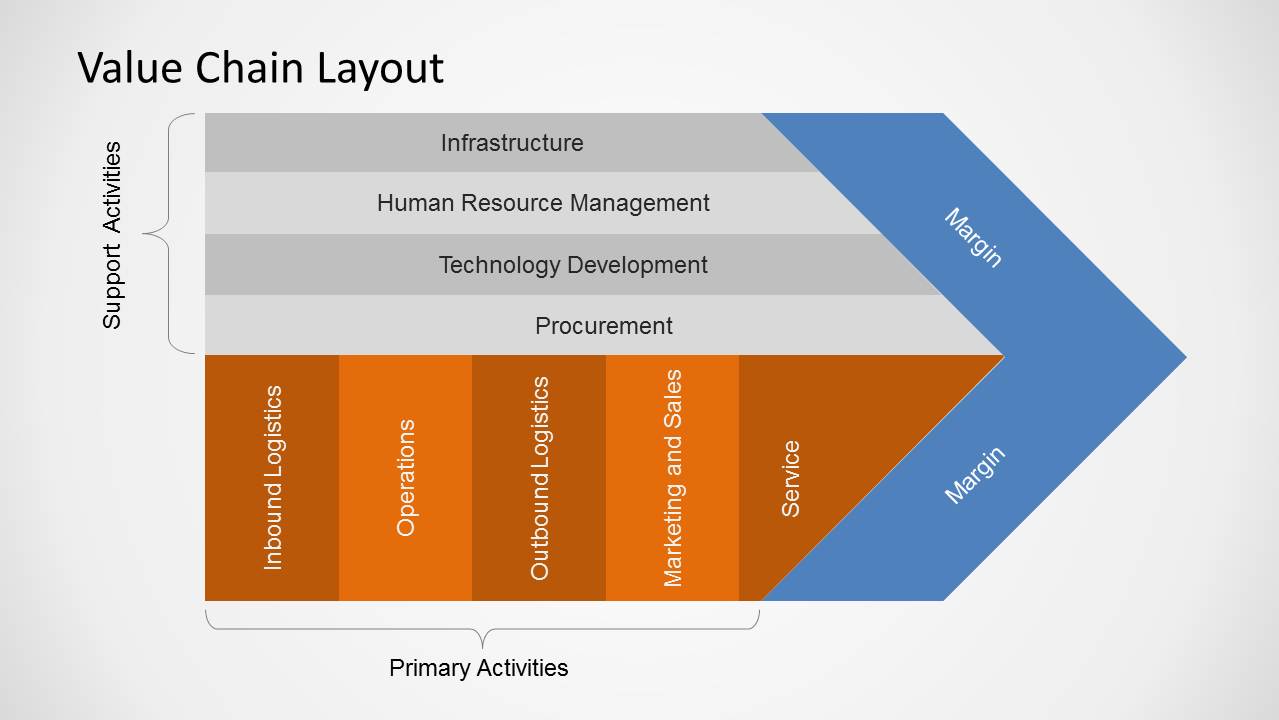
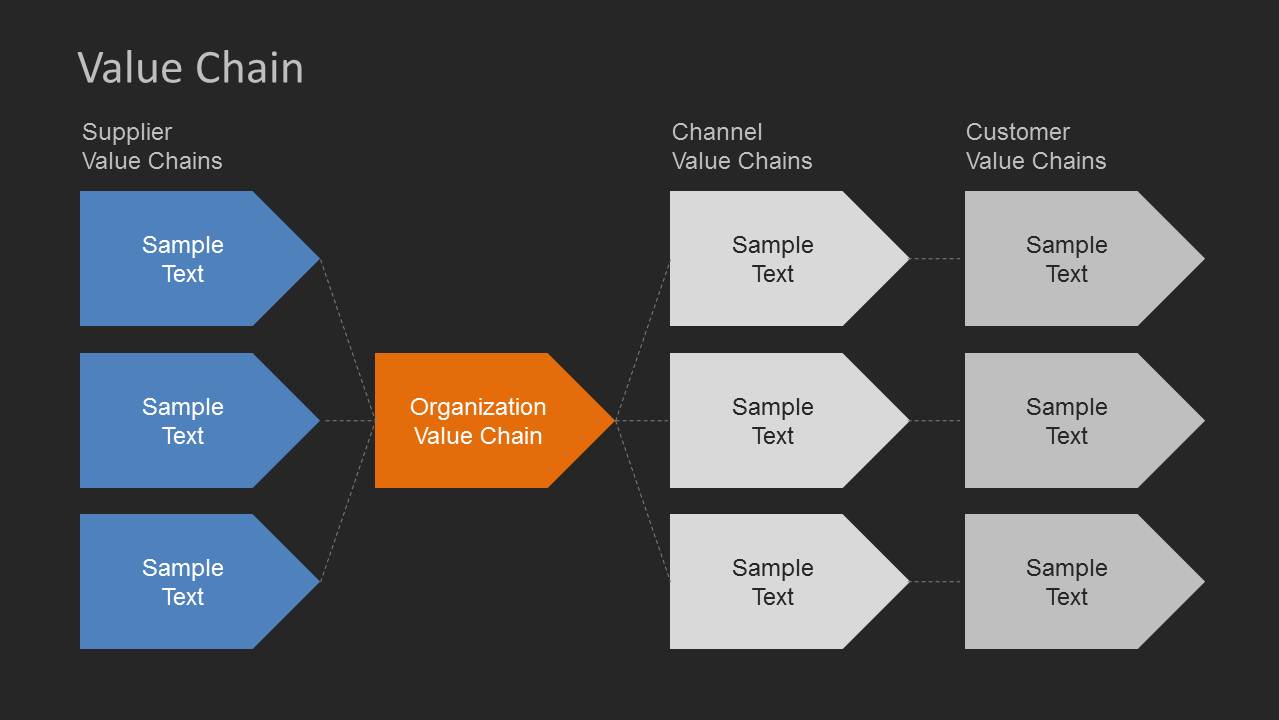
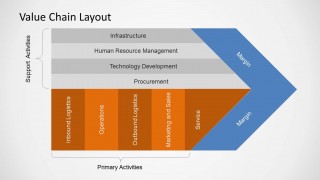
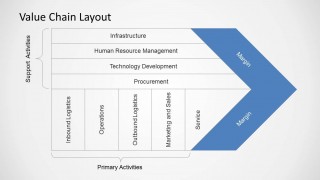
- An operations manager can present an internal process review by using the Porter-style value chain layout to separate support activities from primary activities and show where margin is created.
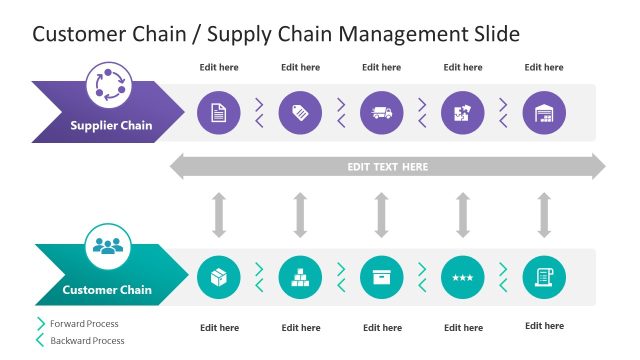
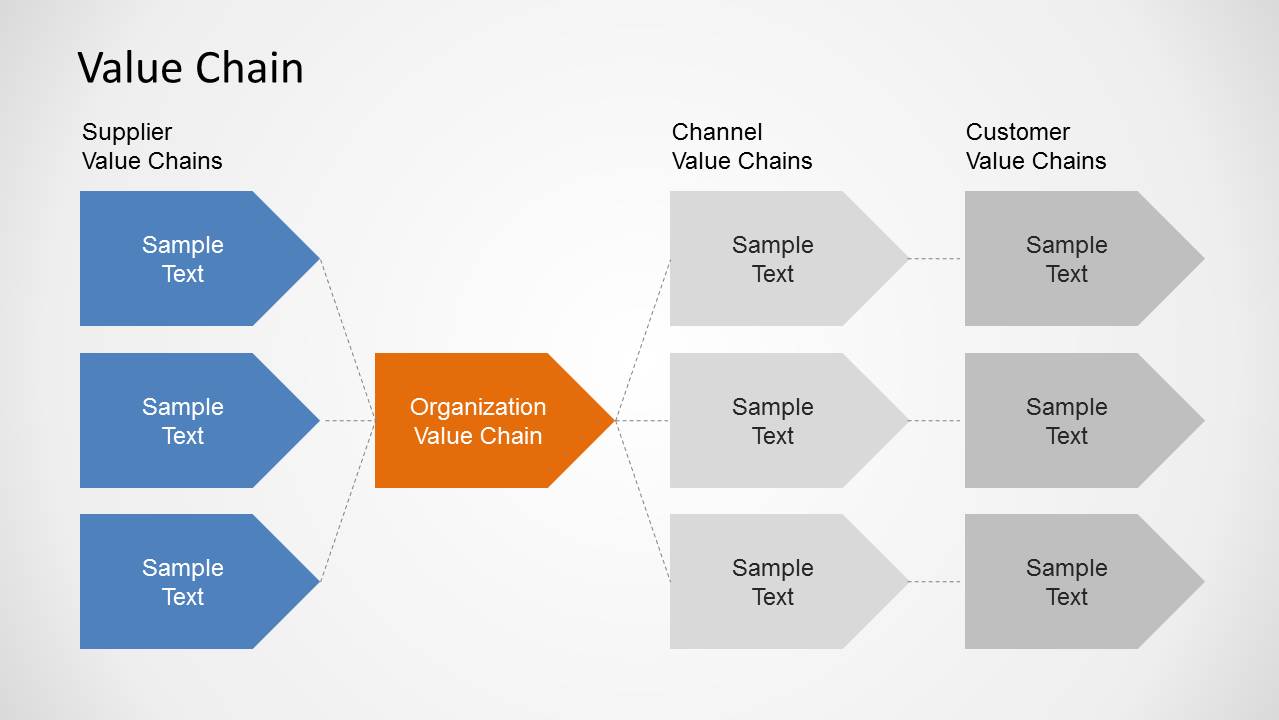
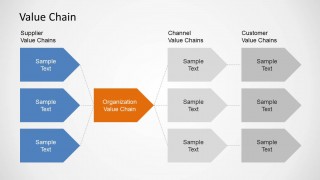
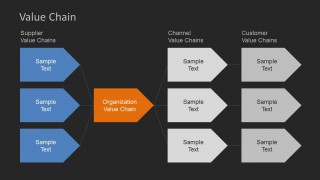
- A strategy consultant can explain a client business model by using the supplier-channel-customer map to show how external value chains connect to the organization value chain.
- A product manager can use the primary activity columns for inbound logistics, operations, marketing and sales, and service to discuss handoffs across the product lifecycle.
- A supply chain leader can brief executives with the dark network map to compare supplier, channel, and customer dependencies around the central organization value chain.
Features
- 100% editable presentation template
- Compatible with Microsoft PowerPoint and Google Slides
- 16:9 aspect ratio slides
- Scalable vector shapes, icons and illustrations
- AI-Ready for Microsoft Copilot and Claude
- Instant access and download
Frequently asked questions
Q: How should I structure a presentation with these value chain diagrams?
A: Start with the Porter-style value chain slide to define the internal operating model, then move to the supplier-channel-customer map to place the organization in its broader ecosystem. Keep each activity label short and use the margin arrow to connect operational choices to business outcomes rather than treating the diagram as a static process list.
Q: Who benefits most from using this template?
A: This template fits presenters who need to explain how work moves across functions and partner relationships, especially operations leaders, product managers, strategy consultants, and supply chain teams. It is strongest when the audience must understand the difference between support activities, primary activities, and external value chains before making process or investment decisions.
Q: Why does the value chain arrow metaphor work for business communication?
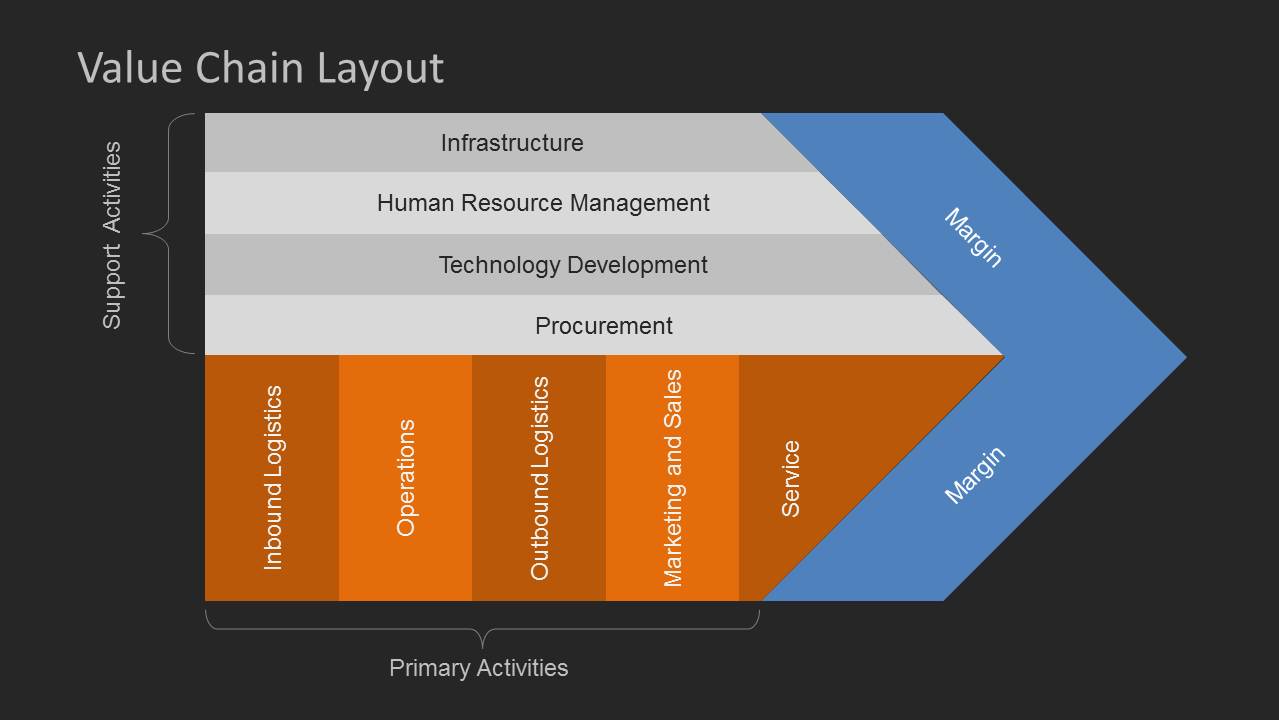
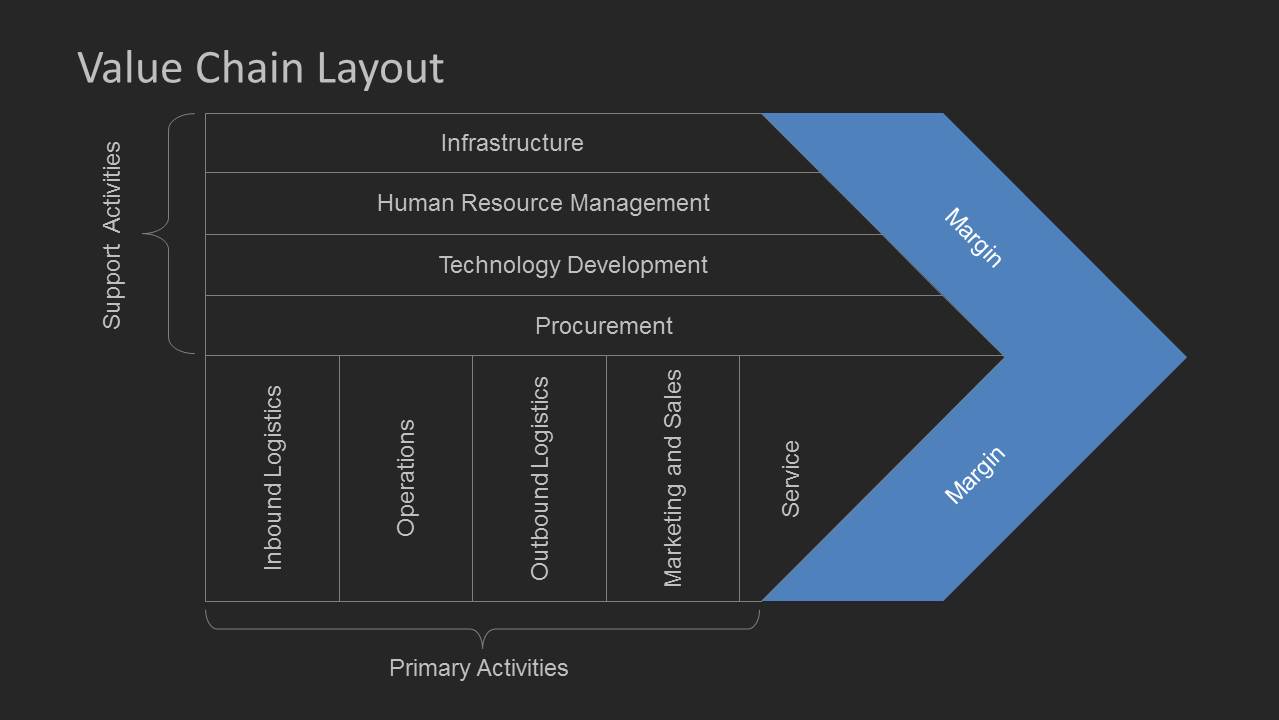
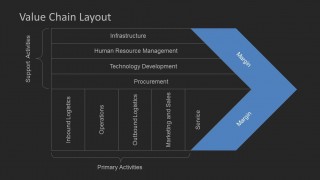
A: The arrow shape turns a complex operating model into a directional value story: activities build toward margin. The stacked support rows show functions that enable the whole chain, while the vertical primary blocks show activity flow. The external map extends the metaphor by showing suppliers, channels, and customers as connected chains rather than isolated stakeholders.

Value Chain Diagrams for PowerPoint
6-slide value chain diagram template for process flow, operations, and supplier-channel-customer mapping
Value Chain Diagrams for PowerPoint is a 6-slide diagram template for mapping organizational activities, supplier relationships, channels, and customers. It includes Porter-style value chain layouts, primary and support activity bands, margin arrows, and supplier-channel-customer value chain maps for operations, product, and strategy teams using Microsoft PowerPoint or Google Slides.
- Category
- Diagrams
- Rating


 Loading...
- Aspect ratio
- 16:9
- Item ID
- 6208-01
- Colors
 Microsoft PowerPoint
  Microsoft Copilot
  Claude for PowerPoint
 Other formats supported
Subscribe today and get immediate
access to download our PowerPoint templates.